. 2023 Sep 12;12:e85867. doi: 10.7554/eLife.85867

Figure 2. Prevalence of key antimicrobial resistance (AMR) genotype profiles by country.

For all countries with ≥50 representative genomes (untargeted, assumed acute cases) from 2010 to 2020, where typhoid is endemic. Percentage resistance values are printed for each country/drug combination, and are coloured by categorical ranges to reflect escalating levels of concern for empirical antimicrobial use: (i) 0: no resistance detected; (ii) >0 and ≤2%: resistance present but rare; (iii) 2–10%: emerging resistance; (iv) 10–50%: resistance common; (v) >50%: established resistance. Annual rates underlying these summary rates are shown in Figure 3 and Supplementary file 8. Full data including counts and confidence intervals are included in Supplementary file 8. MDR, multidrug resistant; XDR, extensively drug resistant; CipNS, ciprofloxacin non-susceptible; CipR, ciprofloxacin resistant; CefR, ceftriaxone resistant; AziR, azithromycin resistant. Countries are grouped by geographical region.

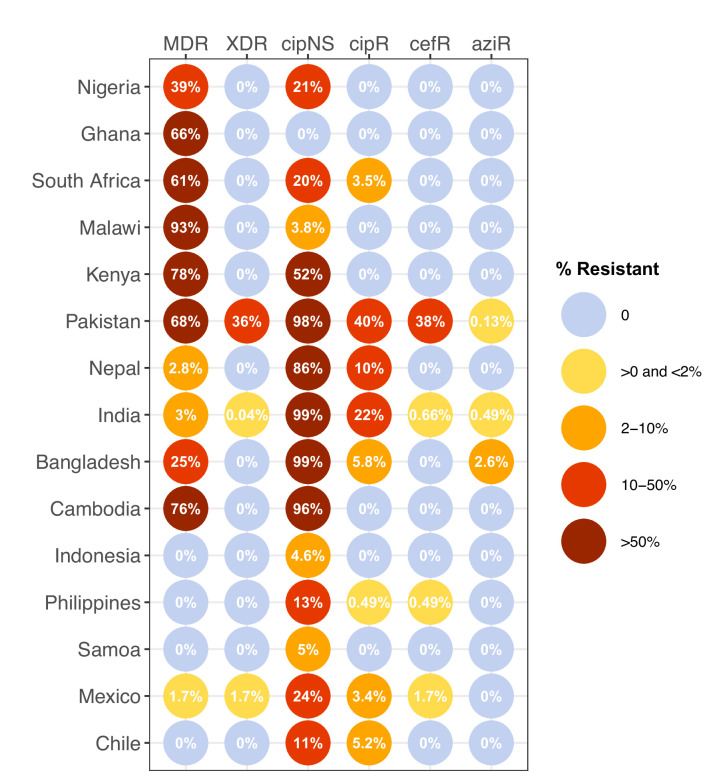
Figure 2.

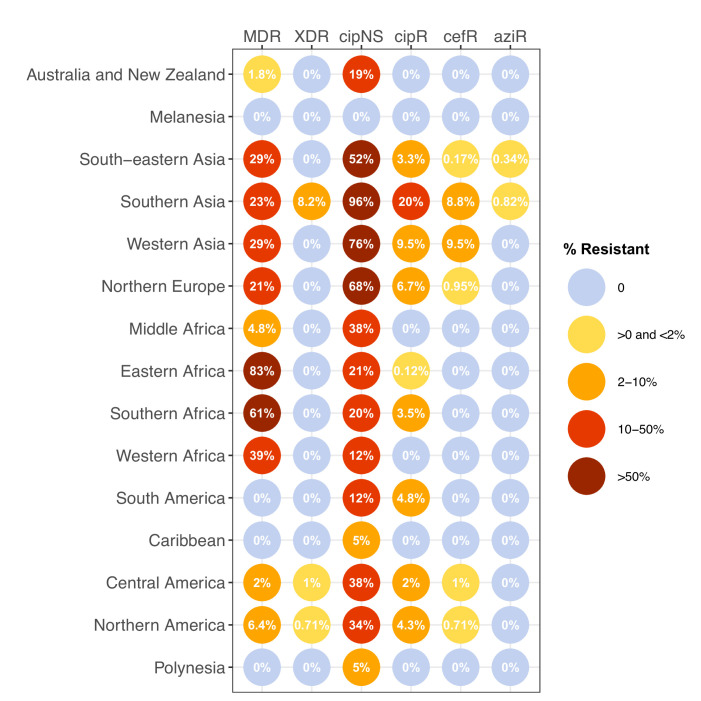
Figure 2—figure supplement 1. Prevalence of key antimicrobial resistance (AMR) genotype profiles by world region, for non-targeted samples, 2010–2020.

Figure 2—figure supplement 1.

Percentage resistance values are printed for each region/drug combination, and are coloured by categorical ranges to reflect escalating levels of concern for empirical antimicrobial use: (i) 0: no resistance detected; (ii) >0 and ≤2%: resistance present but rare; (iii) 2–10%: emerging resistance; (iv) 10–50%: resistance common; (v) >50%: established resistance. Full data including counts and confidence intervals are in Supplementary file 7. MDR, multidrug resistant; XDR, extensively drug resistant; CipNS, ciprofloxacin non-susceptible; CipR, ciprofloxacin resistant; CefR, ceftriaxone resistant; AziR, azithromycin resistant.
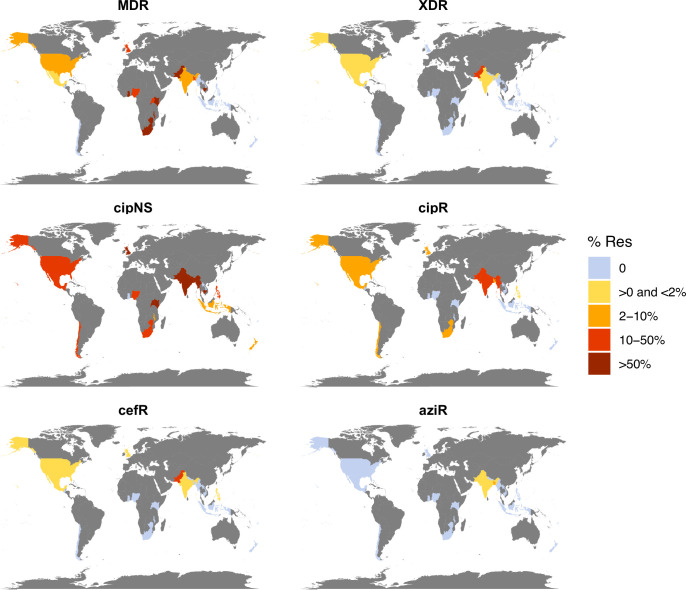
Figure 2—figure supplement 2. Antimicrobial resistance (AMR) prevalence for non-targeted samples, 2010–2020.

Figure 2—figure supplement 2.

Data are shown only for countries with N≥20 isolates (others are coloured grey). Countries are coloured by the prevalence of resistance per country, as per the inset legend. MDR, multidrug resistant; XDR, extensively drug resistant; CipNS, ciprofloxacin non-susceptible; CipR, ciprofloxacin resistant; CefR, ceftriaxone resistant; AziR, azithromycin resistant.
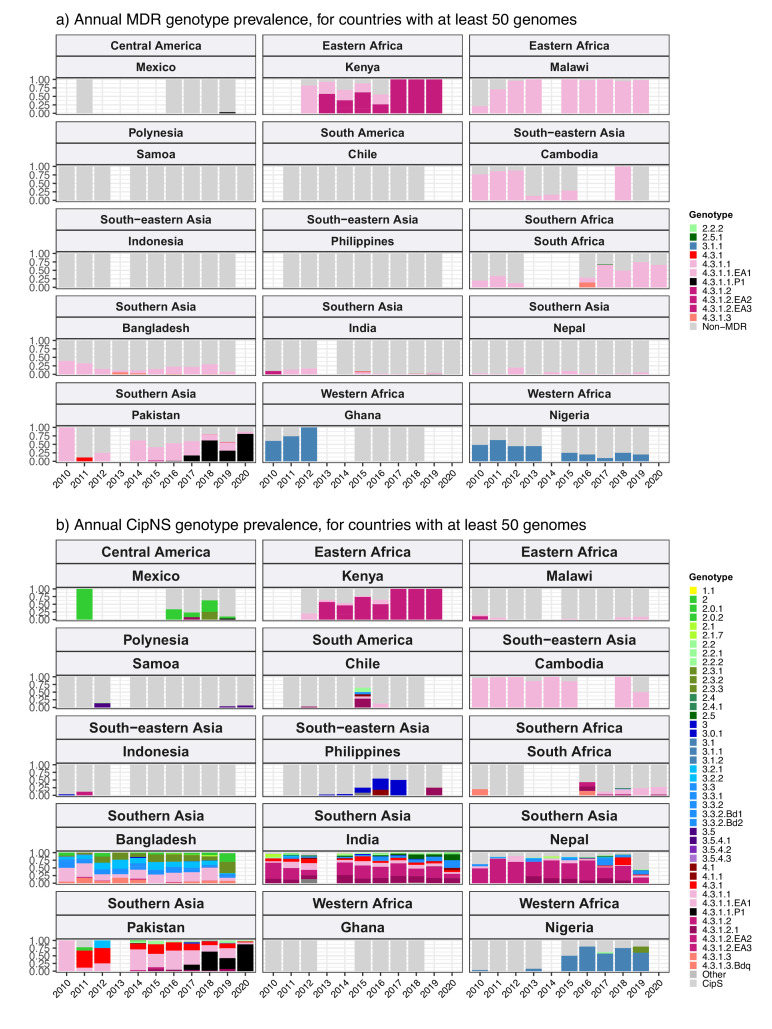
Figure 2—figure supplement 3. Annual genotype prevalence amongst multidrug-resistant (MDR) and ciprofloxacin non-susceptible (CipNS) genomes.

Figure 2—figure supplement 3.

For countries with ≥50 representative genomes between 2010 and 2020 and endemic typhoid. Genotypes for (a) MDR and (b) CipNS genomes are coloured according to the inset legends; sensitive genomes of all genotypes are aggregated and coloured grey.
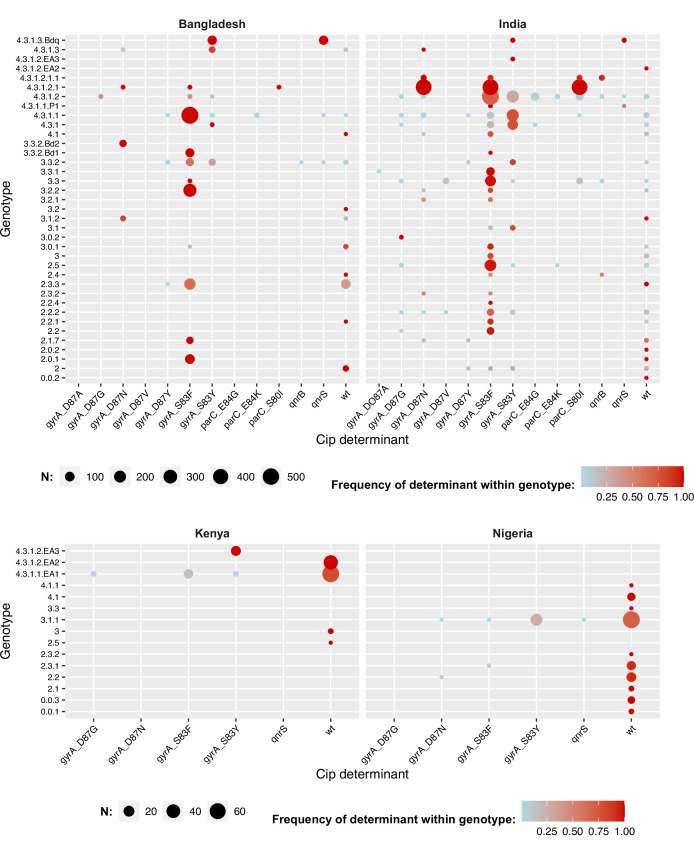
Figure 2—figure supplement 4. Distribution of fluoroquinolone resistance determinants by genotype.

Figure 2—figure supplement 4.

For selected countries discussed in text. Node size indicates total number of isolates for a given combination of genotype (row) and determinant (column); nodes are coloured to indicate the frequency of the determinant within that genotype. Wt = wildtype; that is, no quinolone resistance determining mutations was detected in gyrA or parC and no plasmid-borne quinolone resistance (qnr) genes were detected.
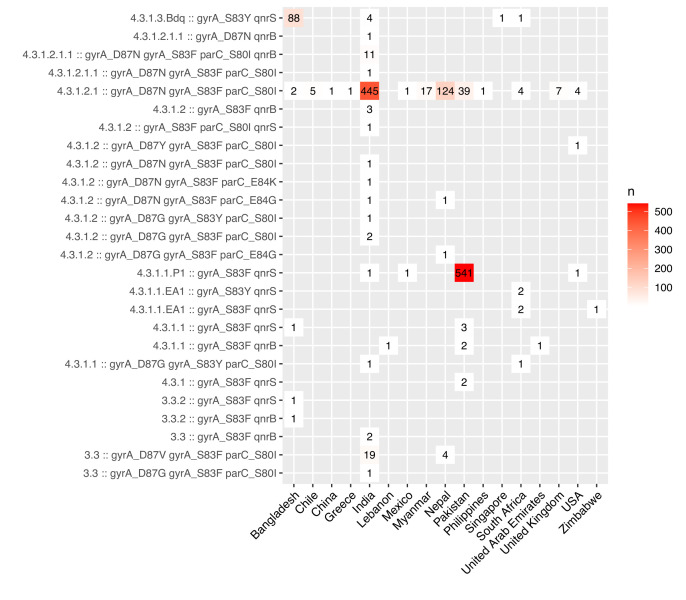
Figure 2—figure supplement 5. Ciprofloxacin-resistant genotypes identified.

Figure 2—figure supplement 5.

Rows show all n=24 unique combinations of Typhi genotype, quinolone-resistance determining region (QRDR) mutations (in gyrA, gyrB, parC, see Methods) and acquired plasmid-mediated quinolone resistance (PMQR) genes (qnrB, qnrD, qnrS) identified in genomes that are predicted to result in ciprofloxacin resistance (presence of ≥1 QRDR mutation+≥1 PMQR gene, or presence of ≥3 QRDR mutations).