. 2023 Sep 12;12:e85867. doi: 10.7554/eLife.85867

Figure 3. Annual prevalence of key antimicrobial resistance (AMR) profiles.

For countries with ≥3 years with ≥10 representative genomes (untargeted, assumed acute cases) from 2000 to 2020. Data are shown only for country/year combinations with N≥5 isolates. MDR, multidrug resistant; XDR, extensively drug resistant; CipNS, ciprofloxacin non-susceptible; CipR, ciprofloxacin resistant.

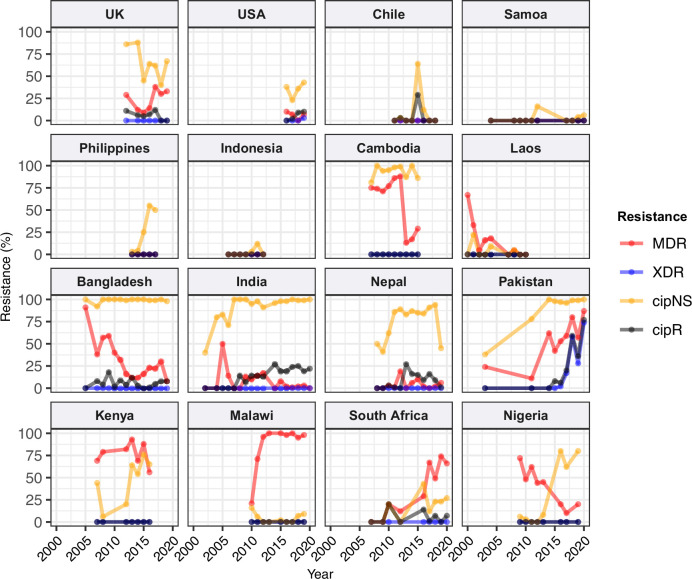
Figure 3.

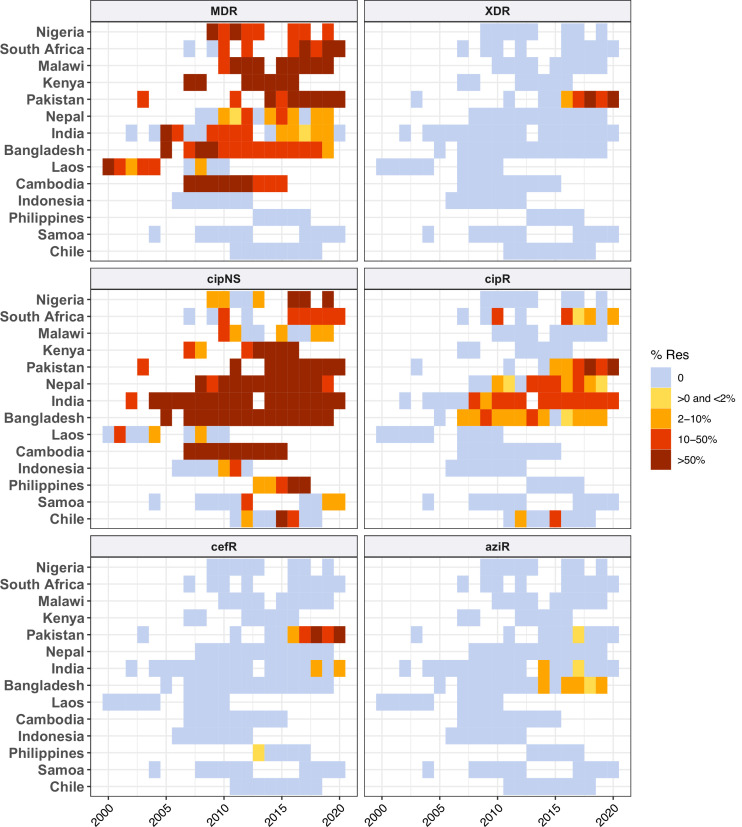
Figure 3—figure supplement 1. Annual prevalence of key antimicrobial resistance (AMR) profiles.

Figure 3—figure supplement 1.

For countries with ≥3 years with ≥10 representative genomes (untargeted, assumed acute cases) from 2000 to 2020 and endemic typhoid. Data are shown only for country/year combinations with N≥5 isolates. MDR, multidrug resistant; XDR, extensively drug resistant; CipNS, ciprofloxacin non-susceptible; CipR, ciprofloxacin resistant; CefR, ceftriaxone resistant; AziR, azithromycin resistant.
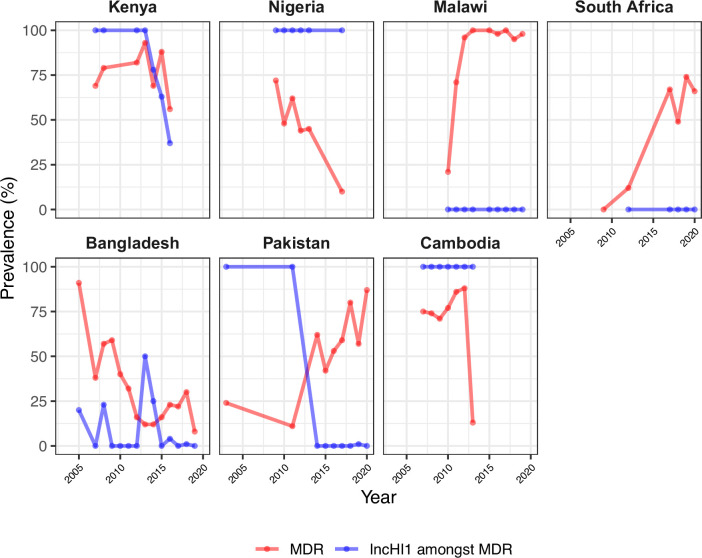
Figure 3—figure supplement 2. Trends in annual frequency of multidrug-resistant (MDR) genomes and proportion of MDR explained by IncHI1 plasmids.

Figure 3—figure supplement 2.

For countries with endemic typhoid and ≥5% MDR prevalence between 2000 and 2020.