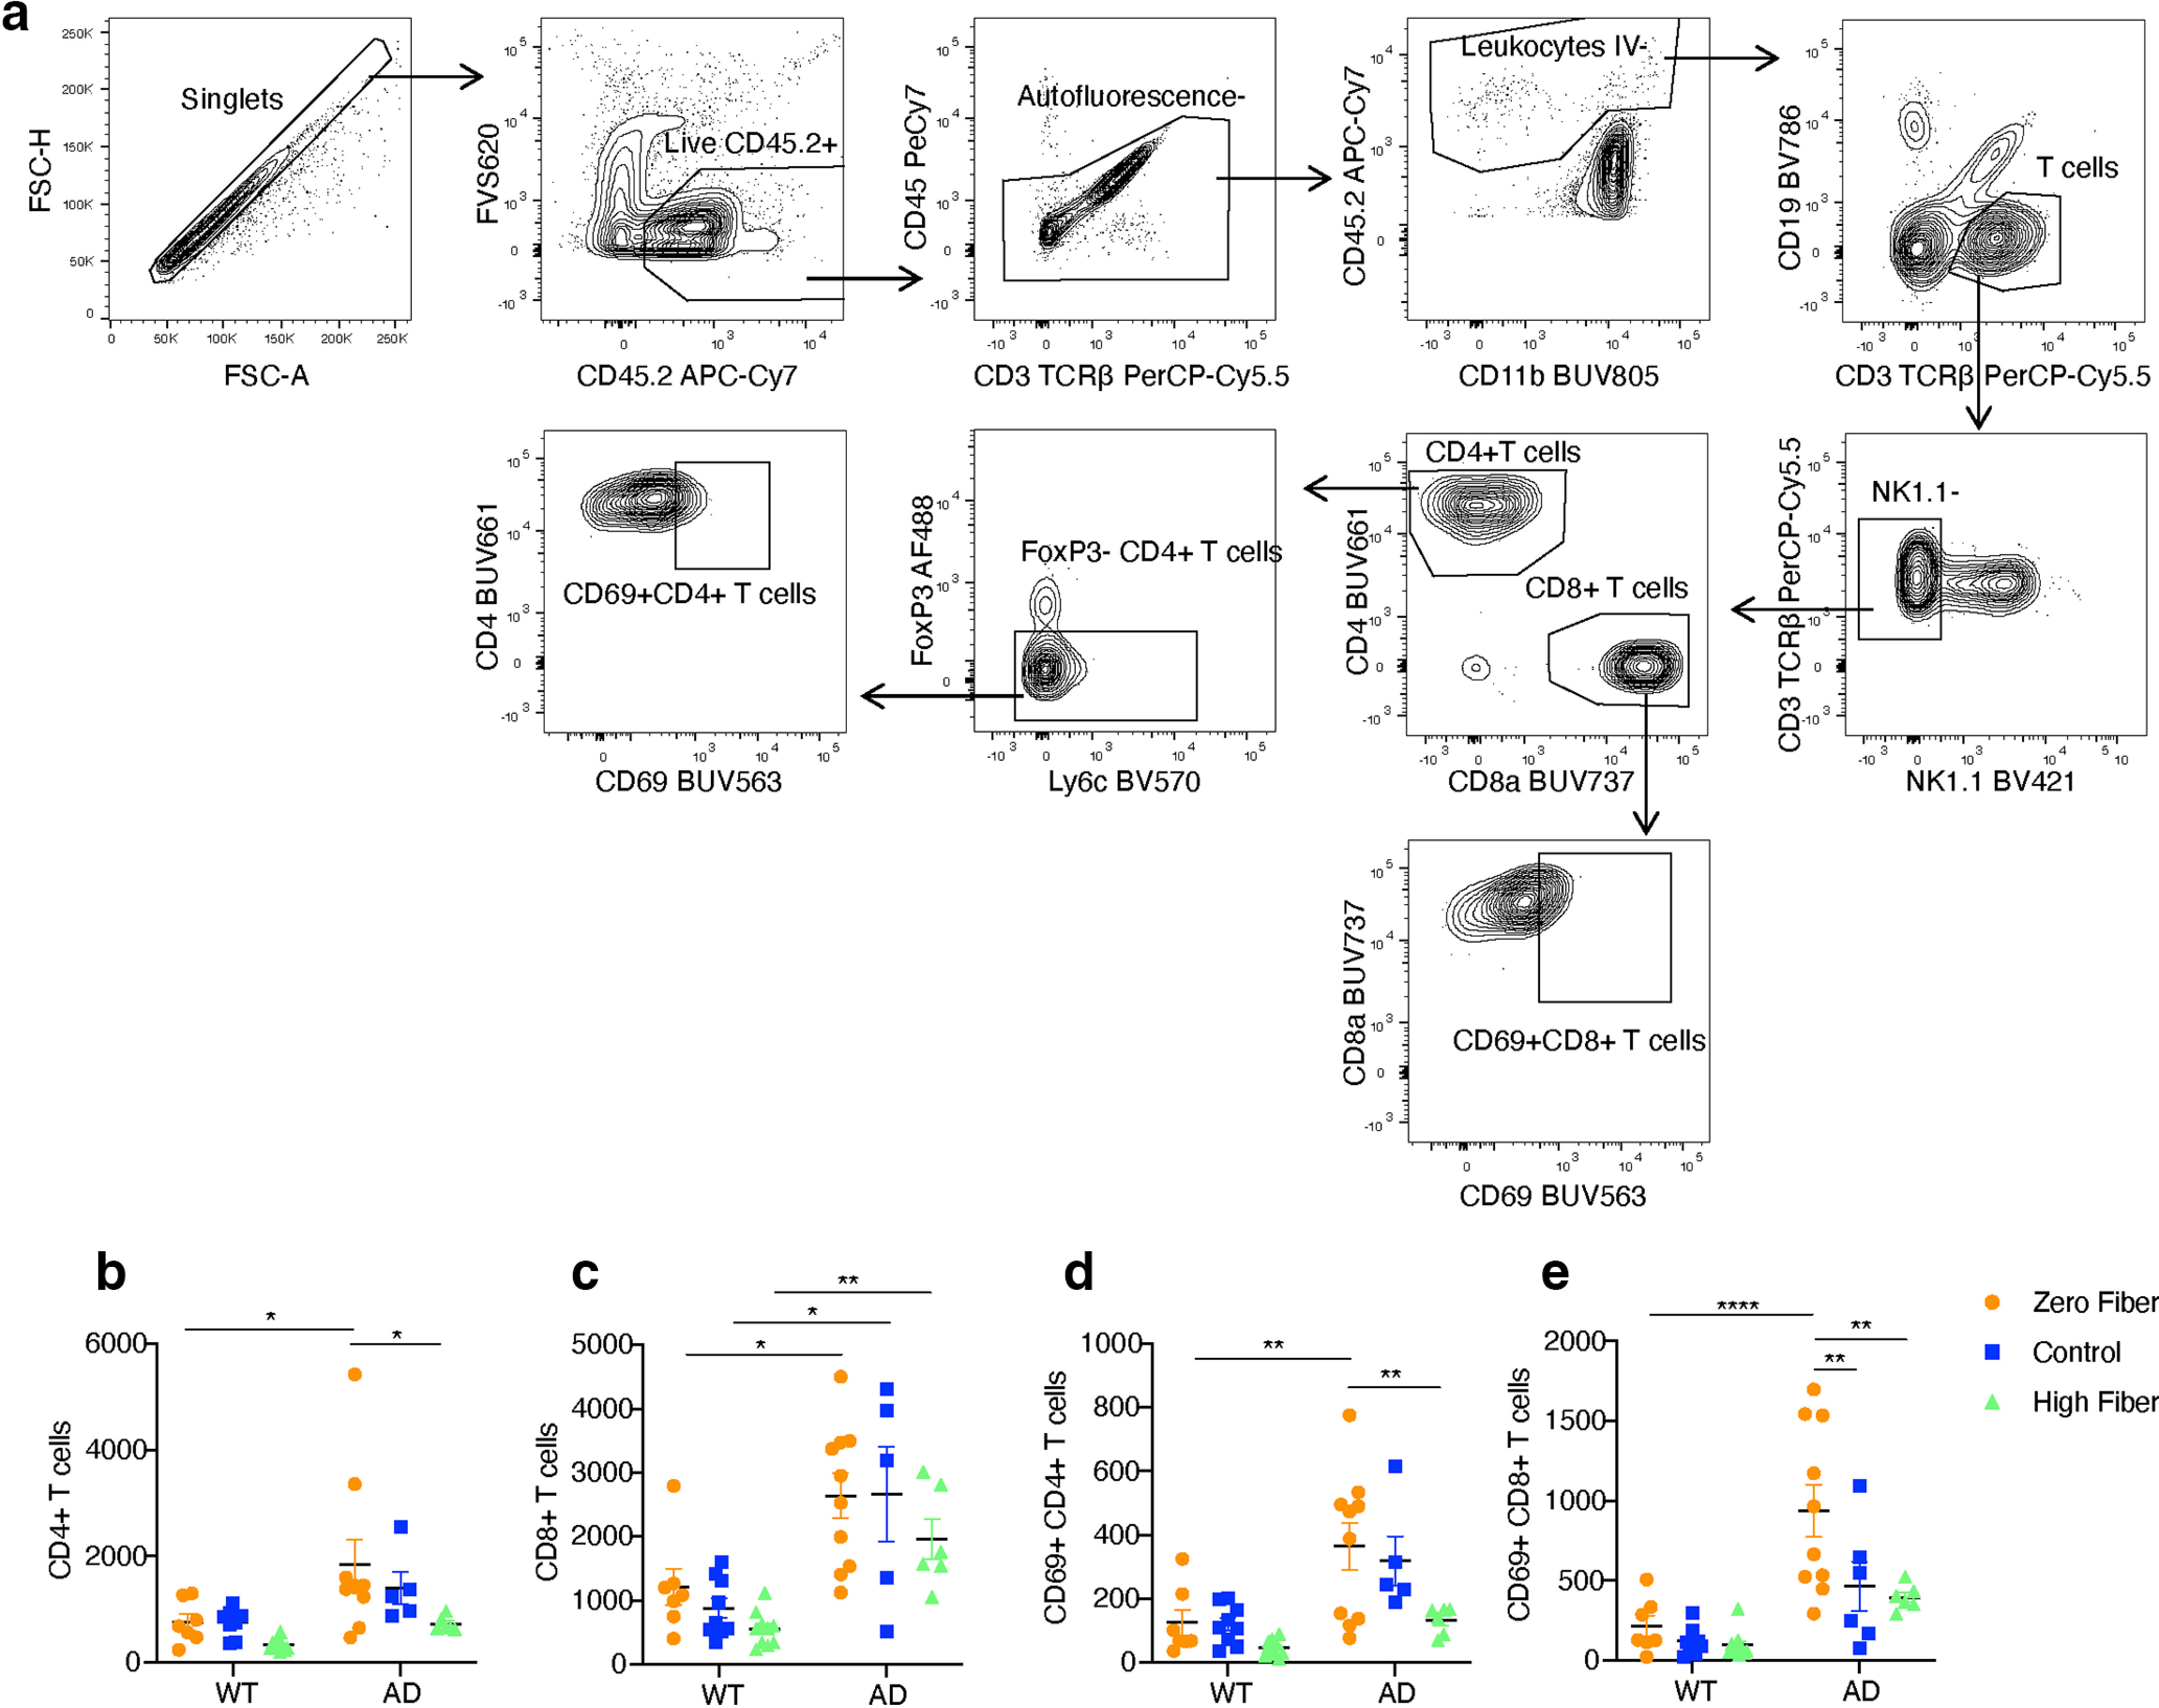
Figure 5.

Dietary fiber affects brain T-cell signature. a, A gating strategy used to identify populations of immune cells. b–e, Quantification of the number of CD4+ T cells (b), CD8+ T cells (c), CD69+ CD4+ T cells (d), and CD69+ CD8+ T cells (e) from 6 month WT mice and 5xFAD mice fed zero fiber, control, or high-fiber diet (WT zero fiber n = 7, WT control n = 9, WT HAMSAB n = 10, AD zero fiber n = 10, AD control n = 5, AD HAMSAB n = 6). Data are mean ± SEM. *p < 0.05; **p < 0.01; ***p < 0.001; ****p < 0.0001; two-way ANOVA and Tukey’s multiple comparison test.
