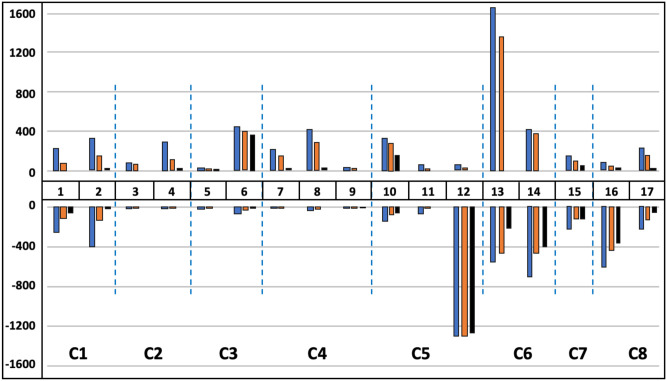
Fig 4. Job losses and gains by occupational groupings, including technological factors.
Sources: Based on BLS Employment Projections 2019–2029, Table 1.2 “Employment by detailed occupation, 2019 and projected 2029” and Table 1.12 “Factors affecting occupational utilization, projected 2019–29”. Occupations are clustered using the Ward hierarchical method based on 72 principal components derived from 220 occupational descriptors from O*NET. Total change is shown in blue, change that has a reason is shown in orange, and change due to technology is shown in black.

