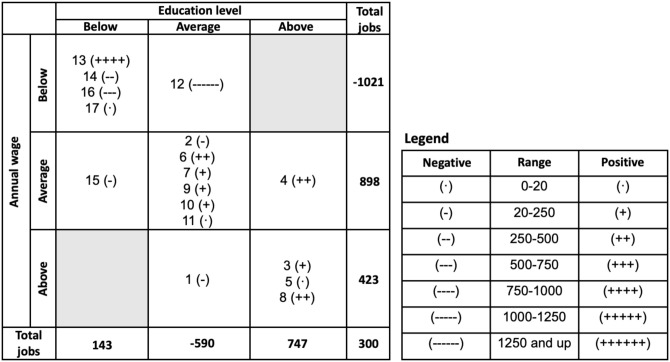
Fig 5. Job losses and gains by occupational groupings—By wage and education level.
Sources: Authors calculations based on BLS Employment Projections 2019–2029, Table 1.2 “Employment by detailed occupation, 2019 and projected 2029”. Occupations are clustered using the Ward hierarchical method based on 72 principal components derived from 220 occupational descriptors from O*NET.

