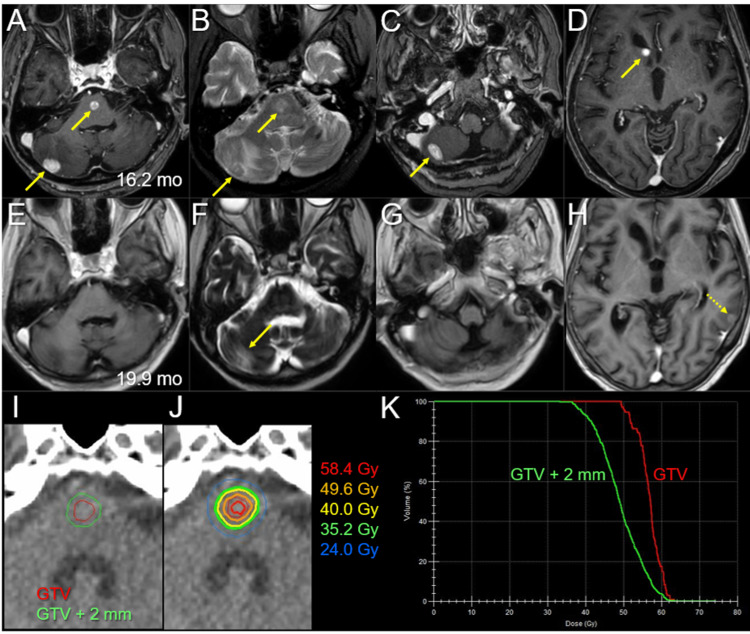
Figure 7. Magnetic resonance images before and after salvage stereotactic radiosurgery.
The images show axial CE-T1-WIs (A, C-E, G, H); axial T2-WIs (B, F); at 16.2 months (mo) after the initiation of WBRT (A-D); at 19.9 months (3.5 months after the initiation of SRS) (E-H); the target definition of the pons lesion (I); the dose distribution (J); the DVHs (K); and the pons lesion (I-K).
(A–H) These images are shown at the same magnification and coordinates under co-registration and fusions. (A-D) Four solid-enhancing lesions (arrows in A, C, and D) are associated with perilesional edema (arrows in B). (E-H) The four lesions regressed completely, only leaving faint perilesional edema (arrow in F); however, a new lesion developed (dashed arrow in H). (J) Five representative isodose lines and the GTV contour are superimposed onto an axial CT image.
CE: contrast-enhanced; WIs: weighted images; mo: months; WBRT: whole-brain radiotherapy; DVHs: dose-volume histograms; GTV: gross tumor volume; GTV + 2 mm: the reference volume generated by adding an isotropic 2-mm margin to a GTV

