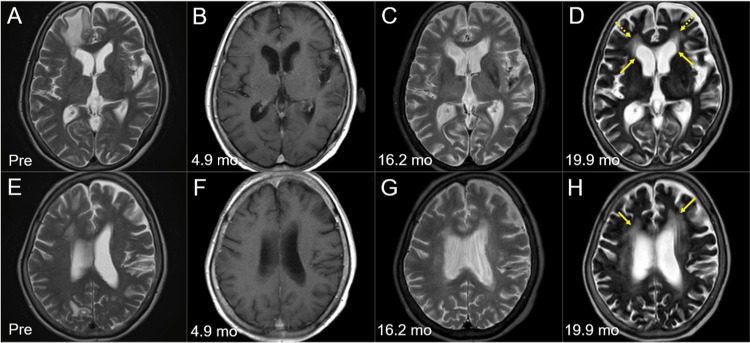
Figure 8. Morphological changes of the brain on magnetic resonance images before and after whole-brain radiotherapy.
The images show axial T2-WIs (A, C-E, G, H); axial CE-T1-WIs (B, F); before WBRT (Pre) (A, E); at 4.9 months (mo) after the initiation of WBRT (B, F); at 16.2 months (C, G); and at 19.9 months (D, H).
(A-H) These images are shown at the same magnification and coordinates under co-registration and fusions. (B, F) T2-WIs were unavailable at 4.9 months. (C, D, G, H) Dilatation of the lateral ventricles (arrows in D) with high-intensity change in the periventricular deep white matter (dashed arrows in D, arrows in H) and widening of the cortical sulci and the Sylvian fissures reflect the progression of brain atrophy and the degenerative changes of the parenchyma.
WIs: weighted images; CE: contrast-enhanced; WBRT: whole-brain radiotherapy

