. 2023 Aug 17;12:e86136. doi: 10.7554/eLife.86136

Figure 1. Study design and identification of age-associated methylation probes.

(A) Study design. (B) Age-associated CpG methylation (False Discovery Rate or FDR p < 0.05) in six cell types. (C, D) SuperExactTest circular plots to show the number of age-associated hypo- and hypermethylated probes shared among different combinations of cell types (indicated by green boxes), respectively. The outermost bars show the number of probes shared among each cell-type combination (regardless of other cell types). For example, probes hypomethylated with age in B + CD4 + CD8 + gran + mono (n = 222) includes probes also hypomethylated in NK cells (n = 181) and probes not hypomethylated with age in NK cells (n = 41). Based on the exact probability distributions of multi-set intersections, all the overlaps shown are highly statistically significant (p < 10−100). (E) Graphical representation of age-associated hypomethylation in promoter region of RCAN1 in all six cell types. (F) Graphical representation of age-associated hypermethylation in promoter region of KLF14. The methylation status in peripheral blood mononuclear cell (PBMC) and buffy coat are also shown. Missing methylation data are represented in white.

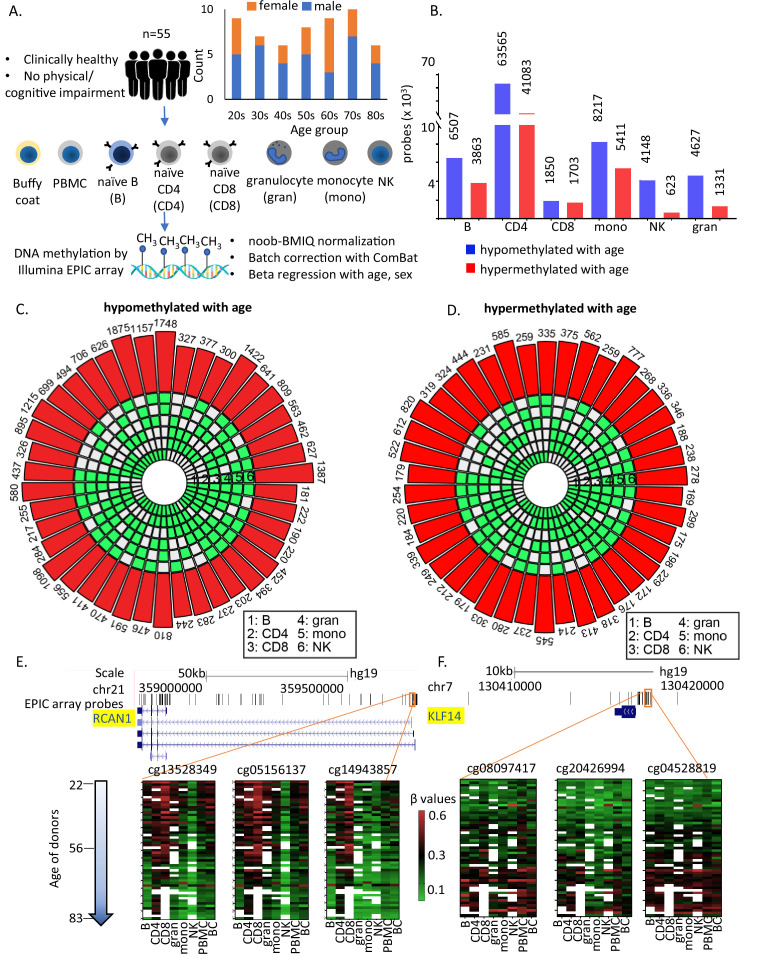
Figure 1.

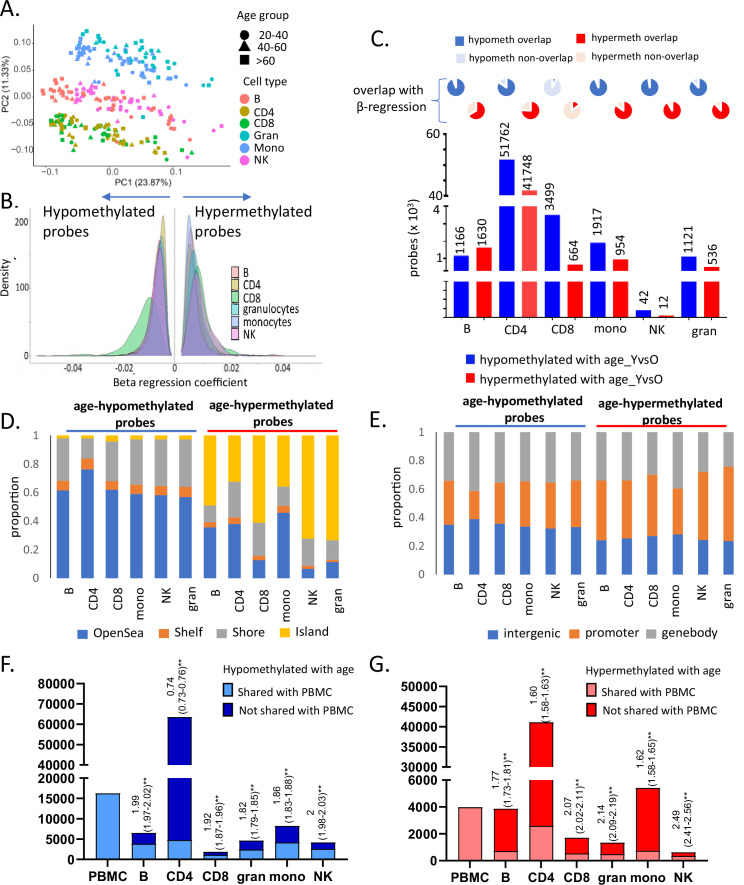
Figure 1—figure supplement 1. Characteristics of entire dataset and age-associated methylation data in six primary immune cells.

Figure 1—figure supplement 1.

(A) Principal component analysis (PCA) plot of normalized methylation data of six immune cells in the 55 healthy donors. The cell types are indicated in different colors, while the three broad age groups (20–40, 40–60, and 60–90 years) are indicated in different shapes (PC1 – principal component 1, PC2 – principal component 2). (B) Distribution of beta-regression coefficient of the age-associated hypo- and hypermethylated probes in all six immune cell types estimated this cross-sectional study. Distribution of coefficient values categorized into groups is shown in Supplementary file 3. (C) Age-associated probes from independent sample t-test analysis of young (≤35 years, 25th percentile) vs old (≥70 years, 75th percentile) donors for each cell type. The pie charts on top show the extent of overlap with results from the beta-regression analysis. (D) Distribution of age-associated probes from beta-regression into groups based on distance from CpG islands (CGI) (Island – within CGI, shore – within 2 kb of CGI, shelf – 2–4 kb of CGI, open sea – >4 kb from CGI). (E) Distribution of age-associated hypo- and hypermethylated probes with respect to location (promoter – 1500TSS to first exon, genebody – within exons, introns, and 3′UTR). (F, G) Overlap of age-associated hypo- and hypermethylated probes in the six immune cell types with those identified in peripheral blood mononuclear cells (PBMCs). The first bar indicates the number of age-associated probes identified in PBMC. The following bars show the counts in the other immune cells, the lighter portion of the bars show the number of probes that are shared with PBMCs, and the darker portion indicates non-PBMC cell-specific probes. The numbers above the bars show the log of odds ratio and its 95% confidence interval to represent the significance of the overlap between age-associated probes in each cell type with PBMC. The p-value from odds ratio analysis is represented as ** as they were all <0.01.