. 2023 Aug 17;12:e86136. doi: 10.7554/eLife.86136

Figure 2. Characteristics of age-associated probes.

(A, B) Manhattan plot of age-associated hypo- and hypermethylated CpG sites in B cells, respectively. Most significant genic probes (−log padj >10) are labeled. (C) Correlation between beta-regression coefficients of age-differentially methylated CPGs in GESTALT and longitudinal InCHIANTI study. X-axis – InCHIANTI, Y-axis – B cell (C) and CD4+ T cell coefficients (D). Blue dots – age-hypomethylated CpGs, yellow triangles – age-hypermethylated CpGs. (E, F) Scatter plot of age-associated CpGs showing opposite trends in different immune cells. (E) cg27123256 (in BCL11B promoter) is hypomethylated with older age in B, monocytes, and NK while is hypermethylated with older age in CD4+ T cells. (F) cg03530364 (in FAM19A1 promoter) is hypermethylated with older age in B, granulocytes, monocytes, and NK cells while it is hypomethylated with older age in CD4+ T cells.

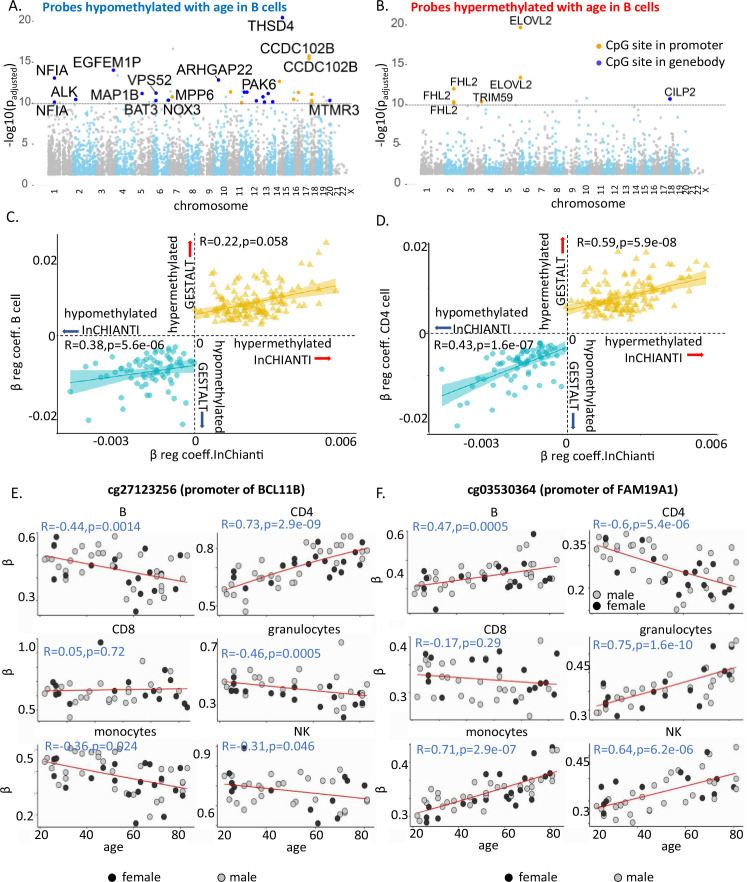
Figure 2.

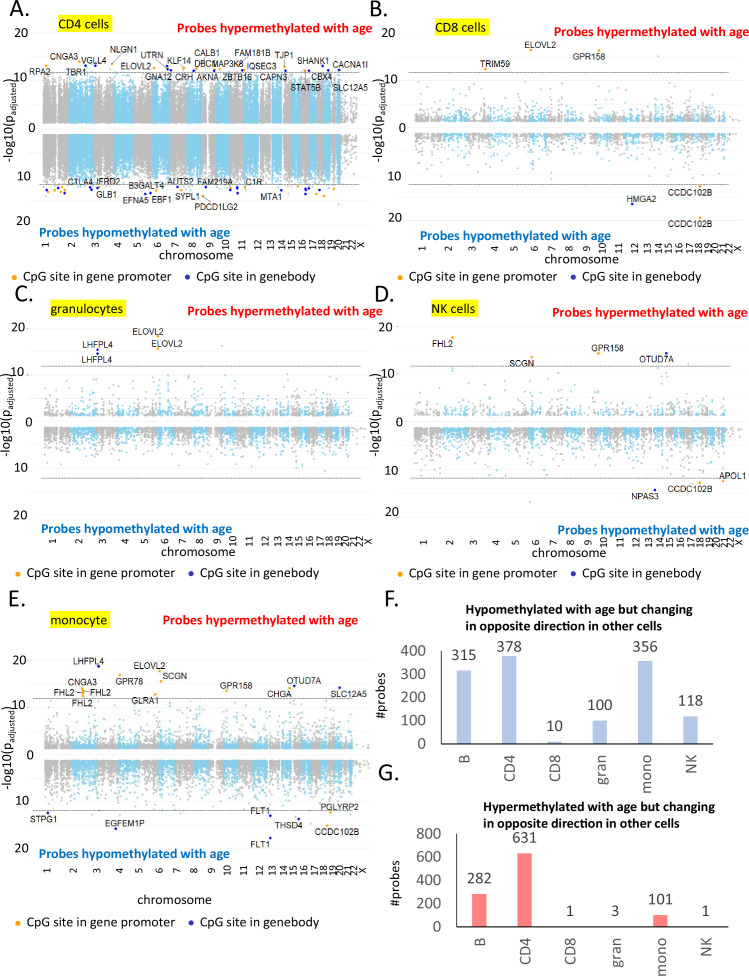
Figure 2—figure supplement 1. Most significant age-associated CpGs in non-B immune cells along with CpGs showing opposite age-associated trends.

Figure 2—figure supplement 1.

(A) Manhattan plot of age-associated CpGs in CD4+ T cells. The X-axis shows the distribution of significant CpGs (FDR p < 0.05), and the Y-axis shows the associated negative log of the adjusted p-value from beta-regression. Positive axis comprises of probes hypermethylated with age while the negative axis shows age-associated hypomethylated probes. The top hits in each group with the most significant p-values are labeled where the orange dot present CpG probes in the gene promoter. (B) Manhattan plot of age-associated probes in CD8+ T cells. (C) Manhattan plot of age-associated probes in granulocytes. (D) Manhattan plot of age-associated probes in NK cells. (E) Manhattan plot of age-associated probes in monocytes. (F) Count of probes hypomethylated with age in cell type of interest but showing hypermethylation in one or more other cell types. For example, 315 probes are age-hypomethylated in B cells but are significantly hypermethylated with age in one or more other immune cell types. Maximum number of such probes are observed in CD4+ T cells followed by B cells and monocytes. (G) Count of probes hypermethylated with age in cell type of interest but showing hypomethylation in one or more other cell types. For example, 282 probes are hypermethylated in B cells but are significantly hypomethylated with age in one or more other immune cell types. Maximum number of such probes are observed in CD4+ T cells followed by B cells and monocytes.
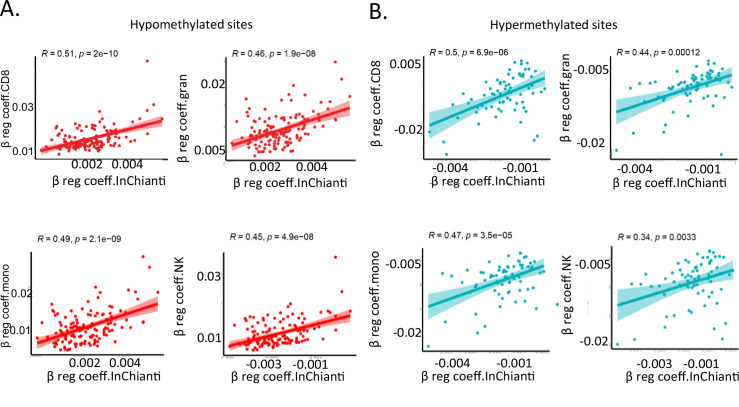
Figure 2—figure supplement 2. Comparison of individual immune cells with InCHIANTI longitudinal study.

Figure 2—figure supplement 2.

(A, B) Correlation between beta-regression coefficients of age-associated methylation probes in five or more cell types in study and beta-regression coefficients estimated from longitudinal data in the InCHIANTI study. On the X-axis is the data from InCHIANTI longitudinal study cohort while on the Y-axis is cell-specific coefficient values for CD8+ T cells (top left), granulocytes (top right), monocytes (bottom left), and NK cells (bottom right). Pink dots are the coefficients of the age-hypomethylated probes (A) while the blue dots are for age-hypermethylated probes (B).