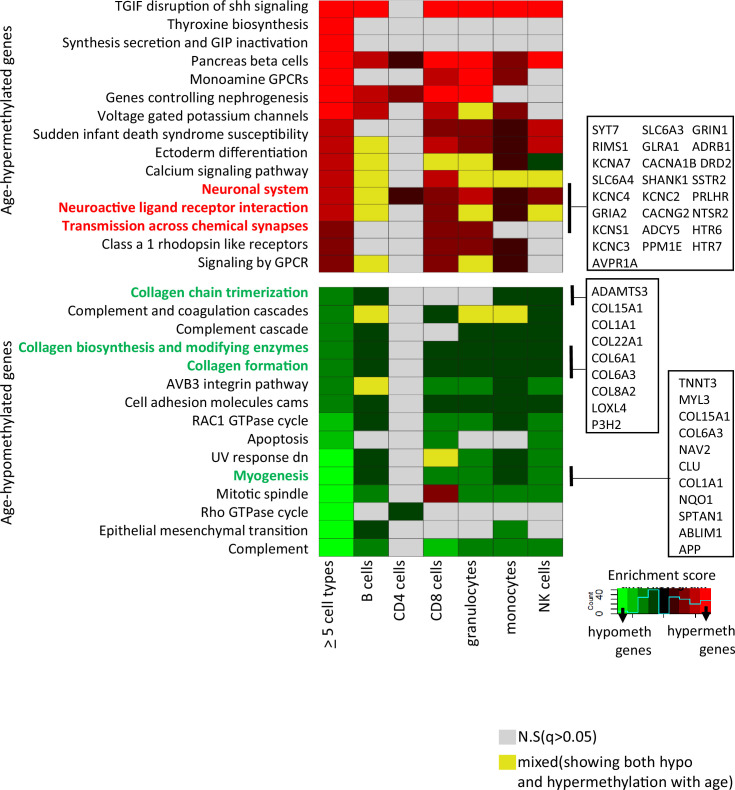
Figure 3. Pathway analysis of methylated probes.
Enrichment analysis of genes annotated to age-associated hypo- and hypermethylated CpGs in ≥5 cell types (left-most column) and in individual cell types. Red/green shades indicate enrichment scores in hyper- (red) and hypo- (green) methylated genes. Yellow indicates ambiguous pathways associated with both hypo- and hypermethylated genes in individual cell types. Not significant pathways are shown in gray. Full results in Supplementary file 6.

