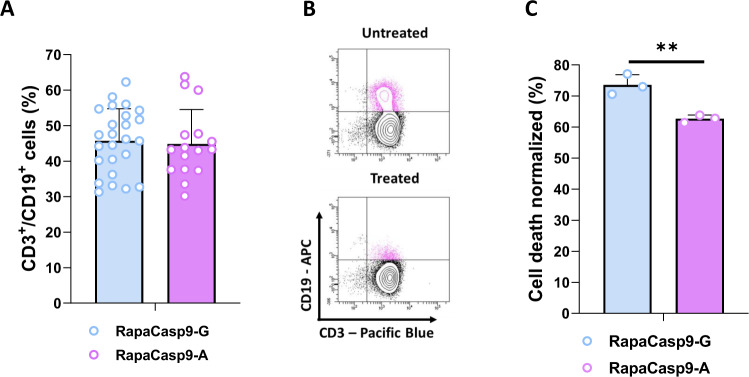
Fig. 2. Generation of functional RapaCasp9-G– or RapaCasp9-A–expressing GMTCs.
A Lentiviral transduction efficiency of T cells determined by flow cytometry. T cells from HDs were genetically modified. Transduction efficiency was analyzed on day 7 after the beginning of production. Mean ± SD of twenty-six (−G) and sixteen (−A) independent experiments. B Representative dot plots of rapamycin-induced killing determined by flow cytometry. C Cell death percentages of cells expressing RapaCasp9-G 24 h after 1 nM rapamycin exposure. Normalized to control cells (DMSO exposure). Cell death was evaluated by Annexin-V/7-AAD labeling and gating on CD3+/CD19+ cells by flow cytometry. Mean ± SD of three independent experiments. **P < 0.01 with unpaired Student t test.

