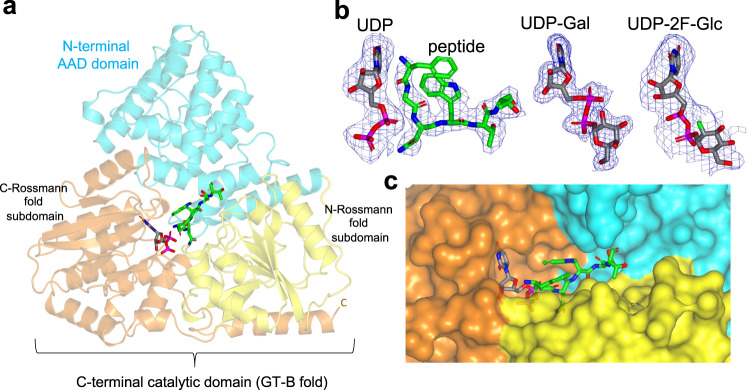
Fig. 2. Crystal structures of AaNGT complexed to UDP-Gal, UDP-2F-Glc, and UDP-FGNWTT.
a Ribbon structure of the AaNGT complexed to UDP and FGNWTT. The N-terminal AAD, the N-terminal Rossmann and C-terminal Rossmann fold subdomains are colored in cyan, yellow and orange, respectively. The UDP nucleotide is depicted with gray carbon atoms whereas the peptide is shown as green carbon atoms. In b Close-up view of the active site showing the bound UDP and FGNWTT, UDP-Gal, and UDP-2F-Glc in the different complexes. Electron density maps are Fo–Fc (blue) contoured at 2.2 σ for all ligands. Except for the first N-terminal residue (Phe1-2) of FGNWTT, the density for the peptide and nucleotides were well defined. c A close-up view of the surface representation of the AaNGT active site is displayed, with the same colors as in panel a.

