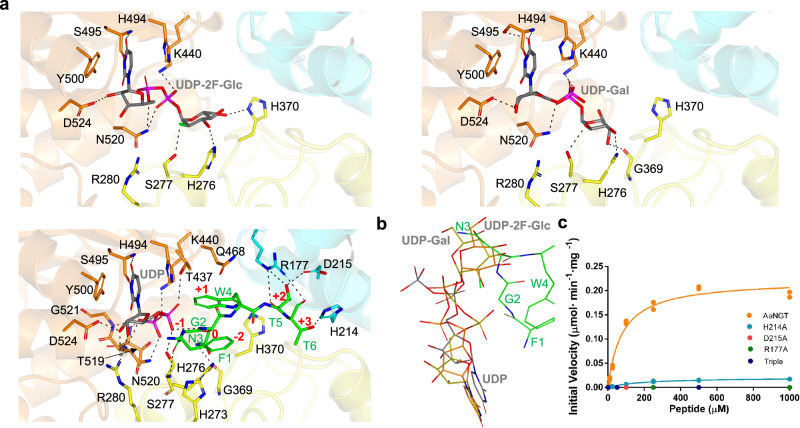
Fig. 3. Structural features of the peptide and sugar nucleotide binding sites of AaNGT.
a View of the active sites of AaNGT-UDP-2F-Glc (upper-left panel), AaNGT-UDP-Gal (upper-right panel), and AaNGT-UDP-FGNWTT (lower-left panel) complexes. Residues are colored according to their location in the different domains and subdomains of AaNGT, with the same color scheme as used in Fig. 2a. The nucleotides UDP and the peptide are shown as gray and green carbon atoms, respectively. Hydrogen bond interactions are displayed as dotted black lines. b Superposition of the different ligands with UDP-Gal as yellow carbon/phosphate atoms, UDP-2F-Glc as orange carbon/phosphate atoms, UDP as gray carbon/phosphate atoms, and FGNWTT as green carbon atoms. c Glycosylation kinetics of AaNGT and mutants, measured against variable concentrations of the peptide FGNWTT and using a saturated concentration of UDP-Glc. Additional kinetic data are provided in Supplementary Table 1. All experiments were obtained in duplicate (n = 2 independent experiments). Source data are provided as a Source Data file.

