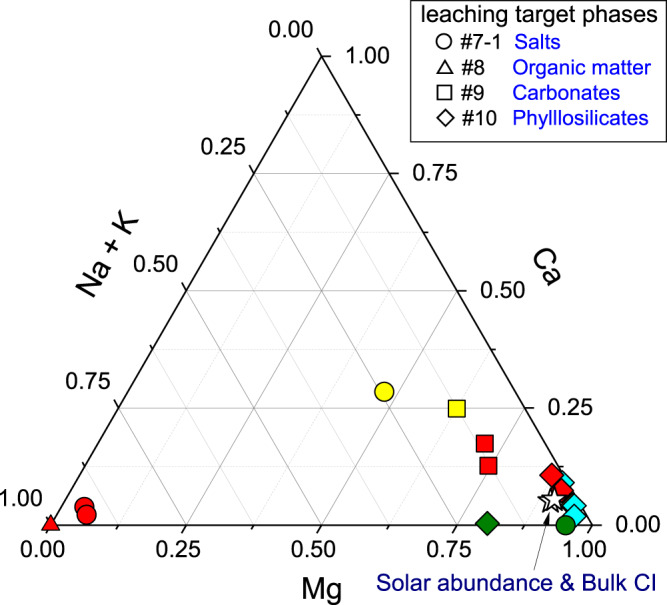
Fig. 2. Ternary diagram illustrating the molar proportions of Mg, Ca, and Na + K in the sequential extracts.

Samples include Ryugu A0106 and C0107 (red), Orgueil (yellow), Tarda, Aguas Zarcas, Jbilet Winselwan (blue), and serpentine (olive), with the bulk compositions of CI chondrite and solar abundance (stars) also plotted for ref. 48. The types of solvents and the main target phases of the leaching experiments are documented in Supplementary Fig. 1B. Data are provided as a Source Data file.
