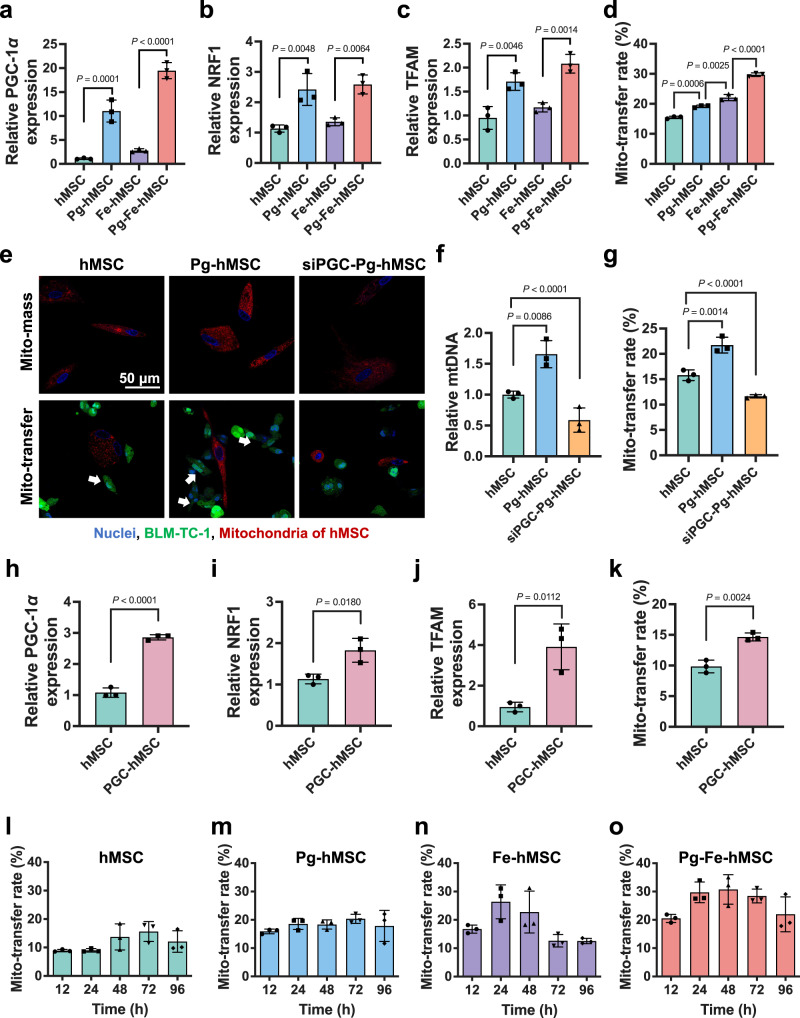
Fig. 2. Increased mitochondrial biogenesis after pioglitazone treatment and enhanced intercellular mitochondrial transfer.
Relative a PGC-1 α, b NRF1, and c TFAM expression in hMSC with different treatments (n = 3 biologically independent cells for each). d Mitochondrial transfer rates of hMSC with different treatments (n = 3 biologically independent cells). e Fluorescence images indicate the correlation between mitochondrial mass and mitochondrial transfer capacity of hMSC, Pg-hMSC, and siPGC-Pg-hMSC. Blue: nuclei; green: BLM-TC-1; red: mitochondria of hMSC; white arrows indicate transferred mitochondria. Scale bar, 50 μm. f Relative levels of mtDNA in hMSC, Pg-hMSC, and siPGC-Pg-hMSC (n = 3 biologically independent cells). g Quantitative analysis of mitochondrial transfer rates of hMSC, Pg-hMSC, and siPGC-Pg-hMSC (n = 3 biologically independent cells). h Relative PGC-1α expression of hMSC before and after the gene transfection using PGC-1α plasmid (n = 3 biologically independent cells). Relative i NRF1 and j TFAM expression of hMSC before and after the gene transfection using the PGC-1α plasmid (n = 3 biologically independent cells for each). k Quantitative comparison of mitochondrial transfer rates between hMSC and PGC-hMSC (n = 3 biologically independent cells). Mitochondrial transfer rates of l hMSC, m Pg-hMSC, n Fe-hMSC, and o Pg-Fe-hMSC at different time points (n = 3 biologically independent cells for each). Data are presented as means ± SD. Statistical significance was analyzed using Student’s t-test (h–k) or ordinary one-way analysis of variance (ANOVA) (a–d, f, g, l–o).

