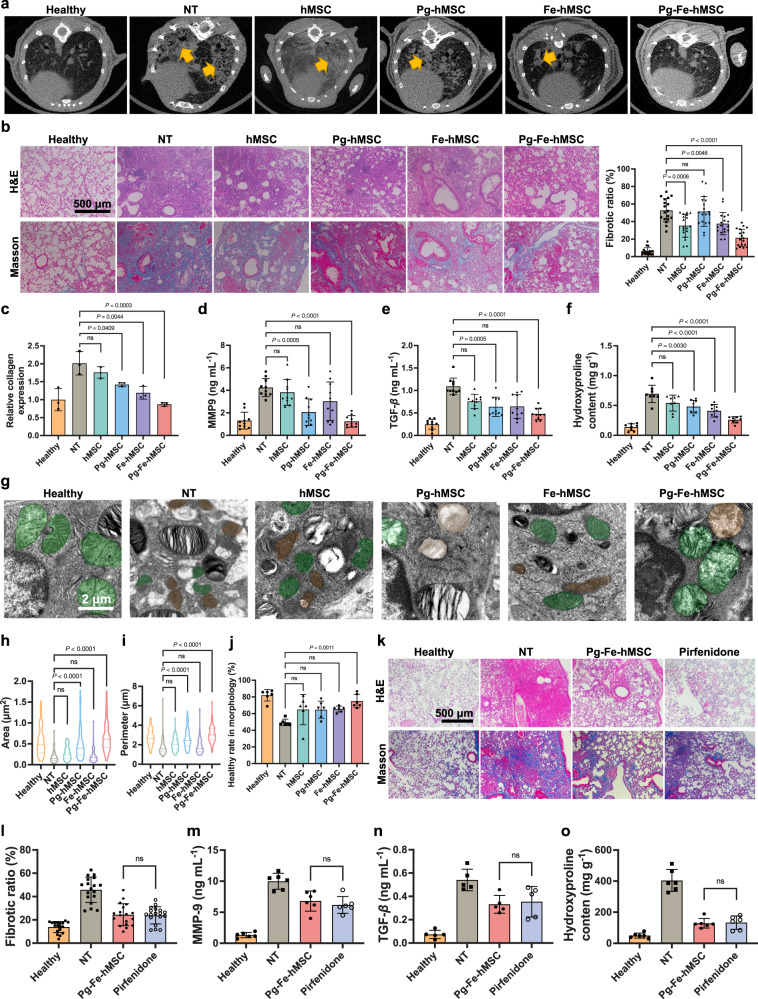
Fig. 4. Therapeutic potential of Pg-Fe-hMSC in the mouse PF model.
a Lung images of mice observed using micro-CT scans after treatments on Day 28 post initial administration of BLM. The yellow arrows indicate the fibrotic features. b Representative lung images of H&E staining and Masson’s trichrome staining of mice with different treatments on Day 28, NT indicates the no treatment groups. Scale bar, 500 μm. The fibrotic ratio was calculated by measuring the percentage of blue area within the pulmonary sections (n = 18, six fields of view from three independent lung sections). c Relative collagen expression in the lung of mice after the indicated treatments (n = 3 biologically independent samples). Expression of d MMP9 and e TGF-β in the bronchoalveolar fluids after the indicated treatments (n = 10 biologically independent samples for each). f Hydroxyproline content in lung homogenates after the indicated treatments (n = 8 biologically independent samples). g Observations of mitochondrial morphology using TEM. Scale bars, 2 μm. Green indicates healthy mitochondria and brown indicates impaired mitochondria. h Area of mitochondria (n = 97 in the healthy group, n = 93 in the NT group, n = 66 in the hMSC group, n = 79 in the Pg-hMSC group, n = 59 in the Fe-hMSC group, n = 74 in the Pg-Fe-hMSC group, mitochondria counted from six independent lung sections for each group) measured according to TEM observations. i Perimeter of mitochondria calculated according to TEM observations (same replicates as h). j Ratios of healthy mitochondria according to morphological observations (n = 6 biologically independent samples). k Representative lung images following H&E staining and Masson’s trichrome staining after the indicated treatments. Scale bar, 500 μm. l Fibrotic ratio of mice’s lungs after the indicated treatments. The ratio was calculated by measuring the percentage of blue area within the pulmonary sections (n = 18, six fields of view from three independent lung sections). Expression of m MMP9, n TGF-β, and o Hydroxyproline in the bronchoalveolar fluid after the indicated treatments (n = six biologically independent samples for each). Data are presented as means ± SD. Statistical significance was analyzed using ordinary one-way ANOVA.

