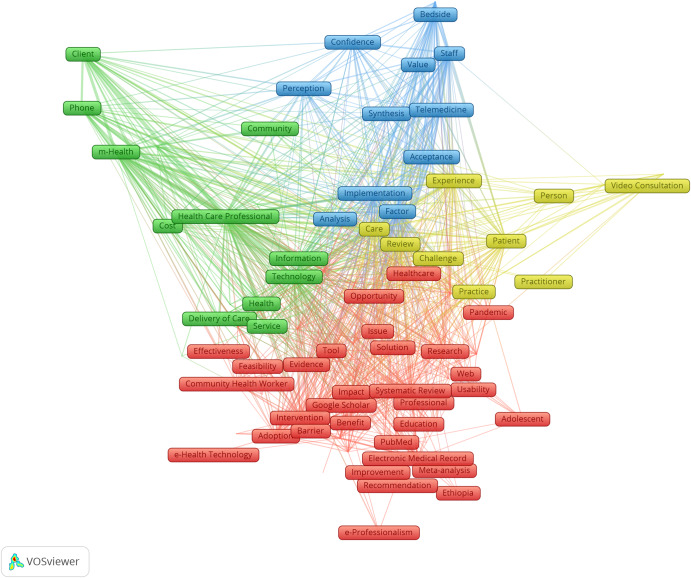
Fig. 2. Overview of the network map of the most frequently identified terms among included studies.
Please note that in the network visualization, items are represented by their label and by default also by a rectangles. The size of the label and the circle of an item is determined by the weight of the item. The higher the weight of an item, the larger the label and the circle of the item. The color of an item is determined by the cluster to which the item belongs.

