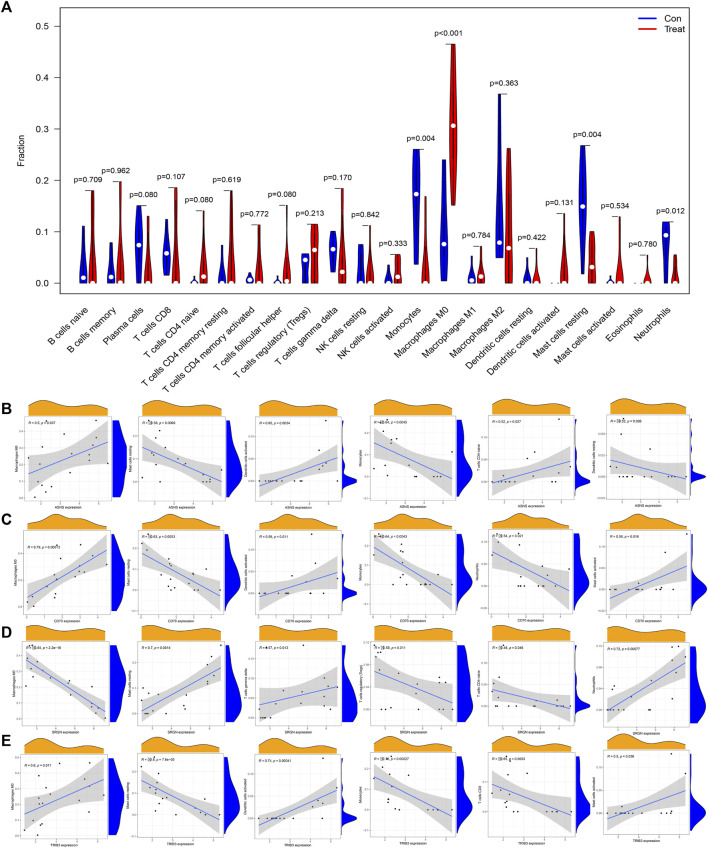
FIGURE 9.
Correlation analysis between diagnostic biomarkers and the infiltration of immune cells in osteosarcoma. (A) Lollipop plot of the association of ASNS, SRGN, CD70, and TRIB3 with immune cells. (B–E) Correlation plots of the association of ASNS (B), SRGN (C), CD70 (D), and TRIB3 (E) with immune cells.

