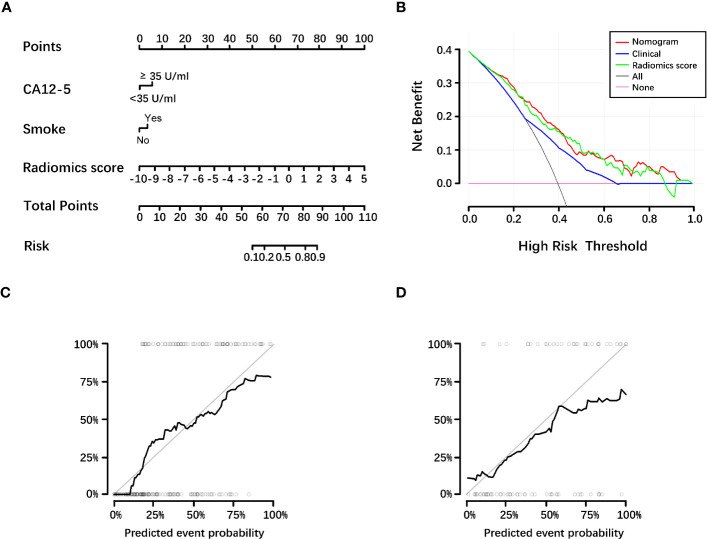
Figure 3.
Diagnostic efficacy of the histological grading nomogram for the differentiation of low-grade and high-grade tumors. (A) Nomogram based on clinical factors and radiomics score. (B) Decision curve analysis for the radiomics score, clinical model and nomogram. Decision curve analysis for the models built with the radiomics score (green line), clinical model (blue line) and nomogram (red line). The y‐axis represents the net benefit. Based on the threshold probabilities obtained, our findings demonstrate that the addition of the radiomics score increased the net benefit of the nomogram, compared with the clinical model. The nomogram achieves more net benefit across the majority of the range of threshold probabilities compared with the clinical model, treat-all strategy (black line), and treat-none strategy (horizontal pink line). (C, D) Calibration curves of the nomogram in the training cohort (C, P = .56) and test cohort (D, P = .13). The nomogram-predicted grade is plotted on the x-axis, and the actual histological grade is plotted on the y-axis. The gray line represents a perfect estimation by an ideal model; the black line represents the performance of the model, and a closer alignment with the diagonal gray line represents a better estimation. CA12-5, carbohydrate antigen 12-5.

