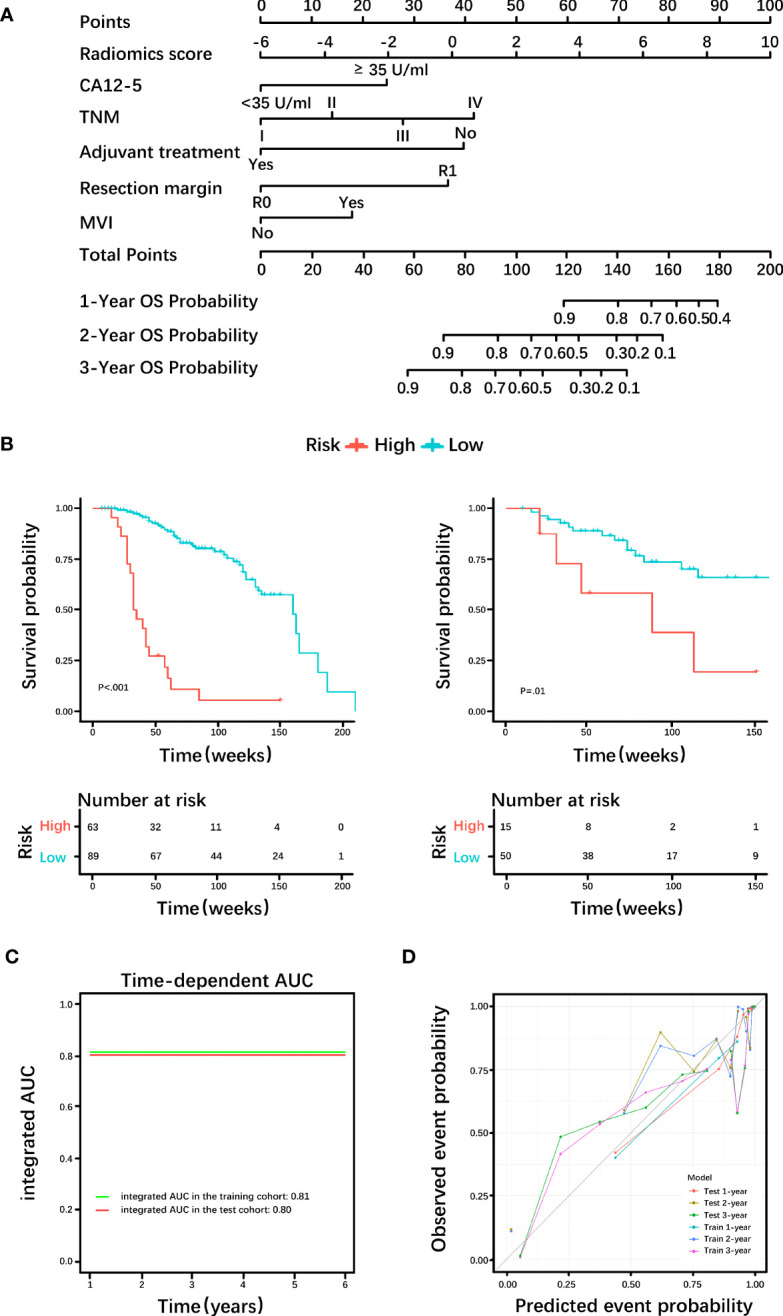
Figure 5.

Diagnostic efficacy of the prognostic nomogram. (A) Nomogram incorporating the radiomics score and clinical factors for predicting the survival probability at 1-, 2-, and 3-years. (B) Kaplan-Meier curves of the prognostic nomogram in the training cohort and test cohort. (C) Integrated area under the receiver operating characteristic (ROC) curve of the prognostic nomogram. (D) Calibration curves demonstrate strong agreement between predicted and actual overall survival (OS) in this model. CA12-5, carbohydrate antigen 12-5; TNM, tumor node metastasis; MVI, microvascular invasion; AUC= area under the receiver operating characteristic curve.
