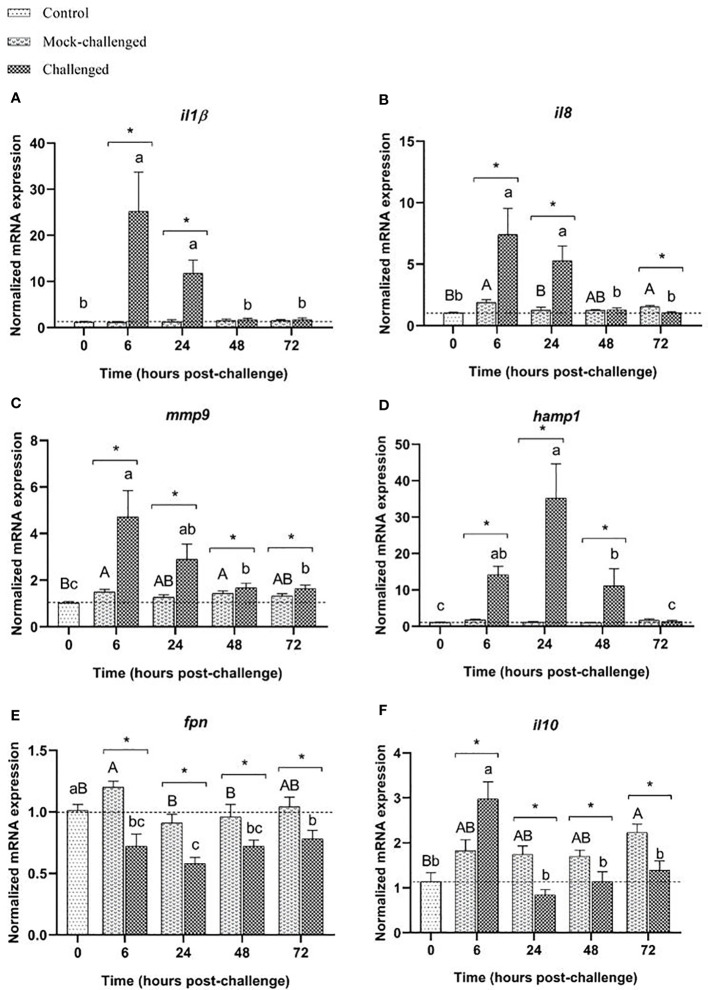
Figure 3.
Expression of (A) il-1β, (B) il8, (C) mmp9, (D) hamp1, (E) fpn and (F) il10 in gills of European sea bass (Dicentrarchus labrax) after bacterial bath-challenge with 5 x 10⁵ CFU mL-1 T. maritimum. Data are expressed as mean ± SEM (n=12 per treatment). Different capital letters indicate differences between control and mock-challenge and lower case letters indicate significant differences between control and challenged groups, while (*) represents statistical differences between mock and challenged fish at each sampling point (One-way ANOVA or Kruskal-Wallis; p ≤ 0.05).

