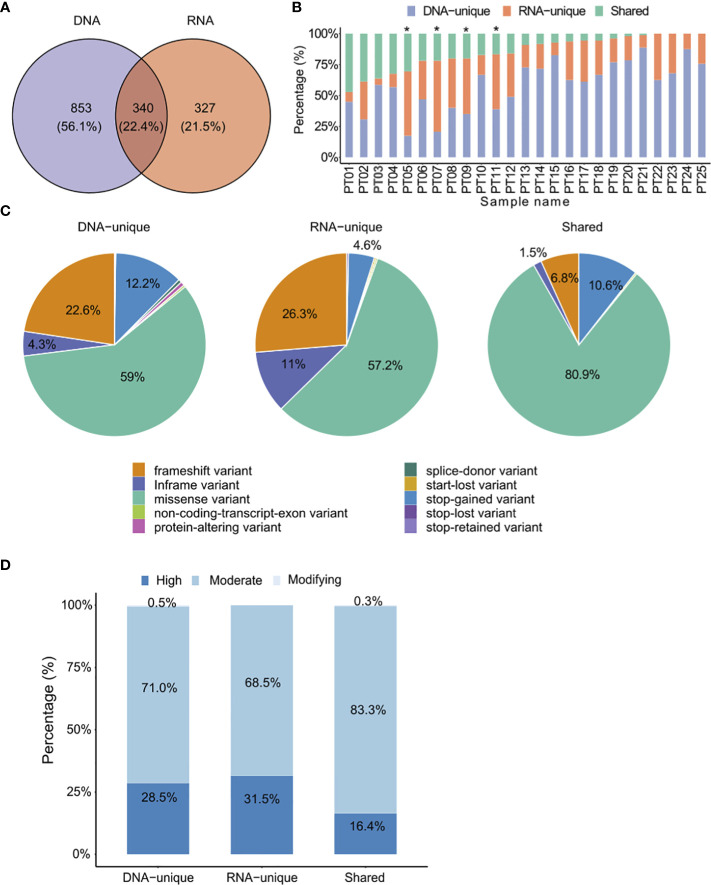
Figure 2.
Comparison of identified somatic mutations between DNAseq data and RNAseq data. (A) Venn diagrams display the numbers of DNA and RNA mutations called by the specified mutation callers on matched tumor-normal DNAseq and RNAseq data from 25 CRC patients. (B) Proportions of each type of variants identified from both DNAseq and RNAseq data for each patient. The graph is presented in descending order based on the proportion of shared variants. Patients marked with an asterisk exhibited a higher proportion of RNA-unique variants compared to DNA-unique variants. (C) Pie charts presenting the percentages of mutation types. (D) The proportions of indicated types of variants in relation to their phenotypic impacts.

