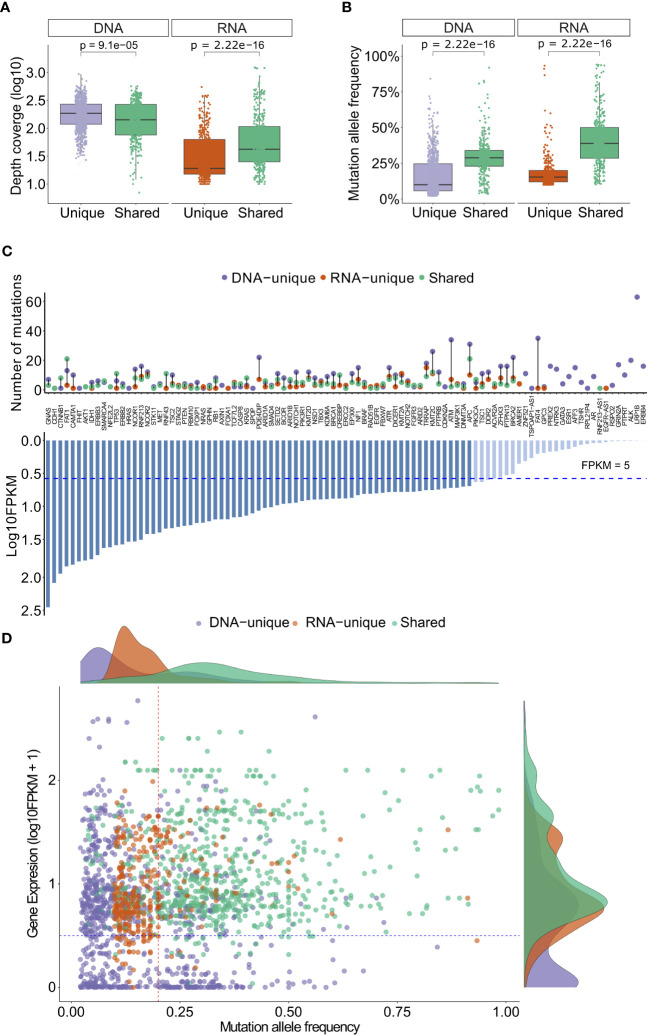
Figure 3.
Depth coverage, MAFs and gene expression levels of variants from DNAseq and RNAseq data. (A) Depth coverage of the indicated groups of variants based on DNAseq and RNAseq data. (B) Mutation allele frequency of the indicated groups of variants. (C) A list of genes with indicated variants, along with their corresponding FPKM. (D) Gene expression levels of different groups of variants in relation to their mutation allele frequency. In (A, B), the boxes represent the median value, as well as the lower and upper quartiles (25th and 75th percentiles). The p-values were obtained from the Wilcoxon rank-sum test.

