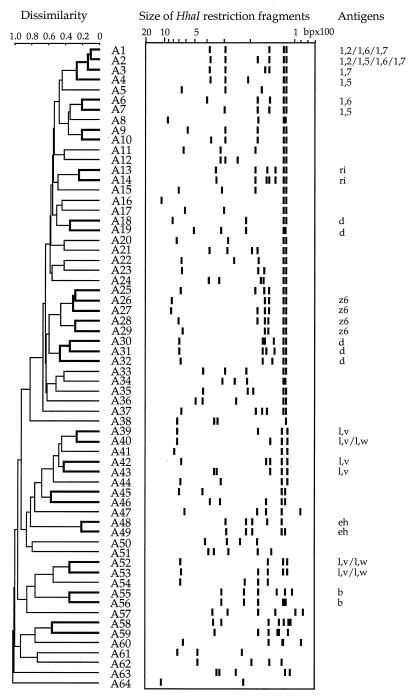
FIG. 1.
Dissimilarity among restriction patterns obtained with HhaI. The dendrogram was generated by the UPGMA method. Clusters obtained with three clustering methods are indicated with thicker lines (robust clusters). Each branch of the tree faces each flagellin banding pattern. Antigenic specificities are indicated when typical of a cluster.

