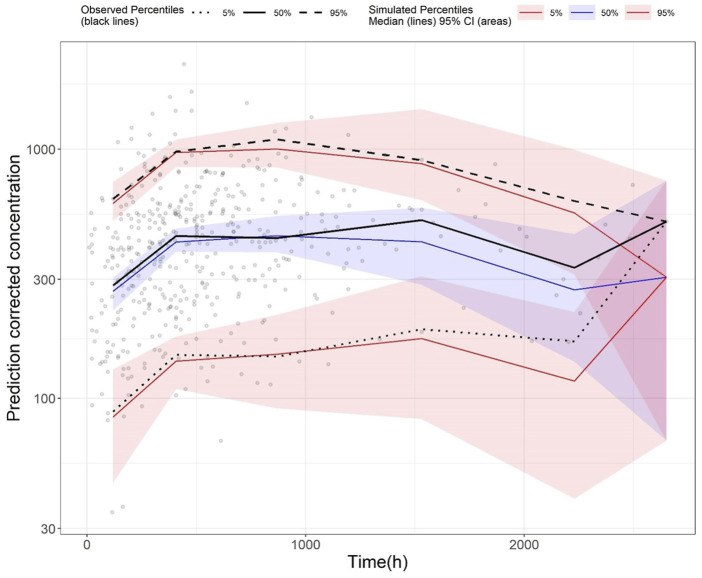
FIGURE 5.
Prediction-corrected visual predictive check (pcVPC) plot of the final model (validation dataset): Grey dots represent the observed concentrations, black-coloured dotted and dashed lines represent the 5th and 95th percentiles of observed data while the solid black line represents the median of observed data. Red-coloured solid lines represent the 5th and 95th percentile of predicted concentration, and blue-coloured solid lines represent the median of the predicted concentration. The shaded areas (red and blue) represent the nonparametric 95% confidence interval of the prediction concentrations.

