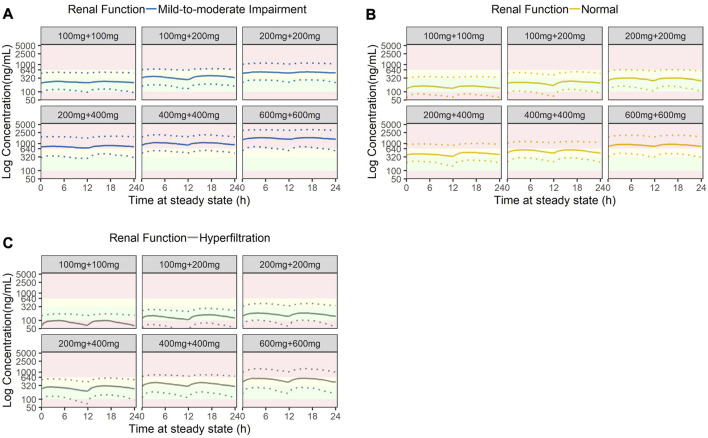
FIGURE 6.
Stochastic simulation of amisulpride plasma concentrations based on three stages of renal function: (A) Mild-to-moderate renal impairment (eGFR = 50 mL/min), (B) Normal renal function (eGFR = 100 mL/min) and (C) Hyperfiltration (eGFR = 200 mL/min). Green shaded areas represent the AGNP therapeutic windows (100 ng/mL to 320 ng/mL); yellow shaded areas represent the concentrations higher than the AGNP therapeutic window but lower than the laboratory alert level (320 ng/mL to 640 ng/mL); red shaded areas represent concentrations outside of the acceptable boundary (beyond 640 ng/mL).

