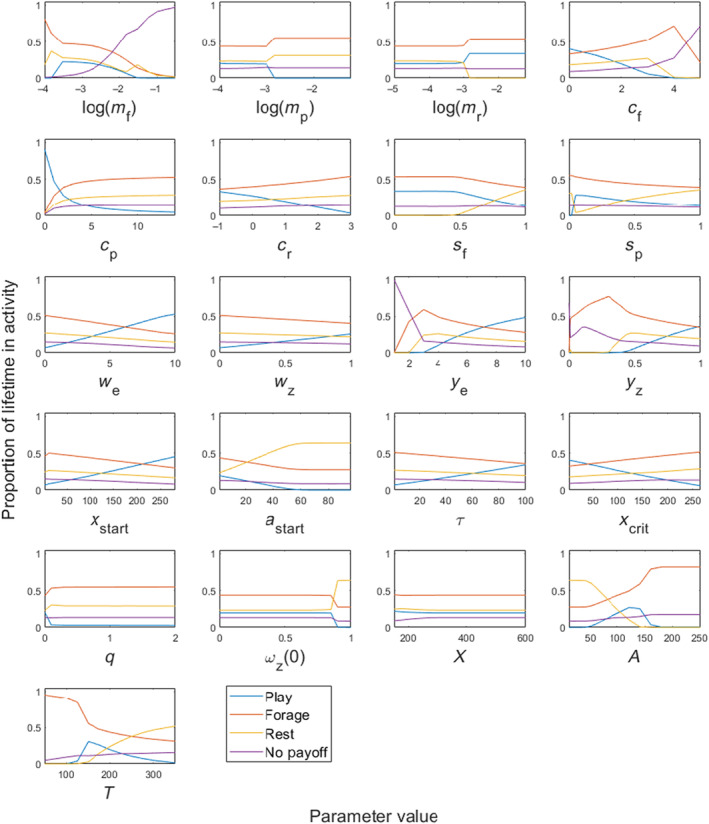
FIGURE A4.

Sensitivity analysis for each parameter for Model 3b: Play as increasing Reproductive Success, s f = 0.8. Effects of modifying one parameter on the proportion of time spent in each activity over the total time of the model. When modifying one parameter, all other parameters are held constant as the default value (see Table 1, main text). Blue = Play, Red = Forage, Yellow = Rest. Purple = Proportion of individuals dead or in a state where it is impossible to attain x crit (and therefore receive a payoff) on average across the total time of the model.
