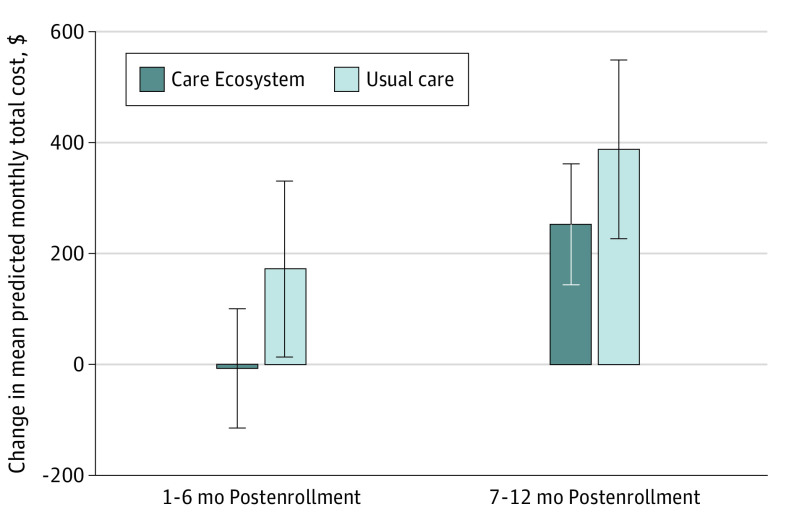
Figure 2. Change Relative to Baseline in Mean Monthly Total Cost of Care Among Patients With 24-Month Continuous Medicare Fee-for-Service Coverage.
Predicted mean monthly total cost of care was found using the Stata margins postestimation command after performing the primary regression analysis with DFBETA outlier treatment. Error bars represent 95% CIs.

