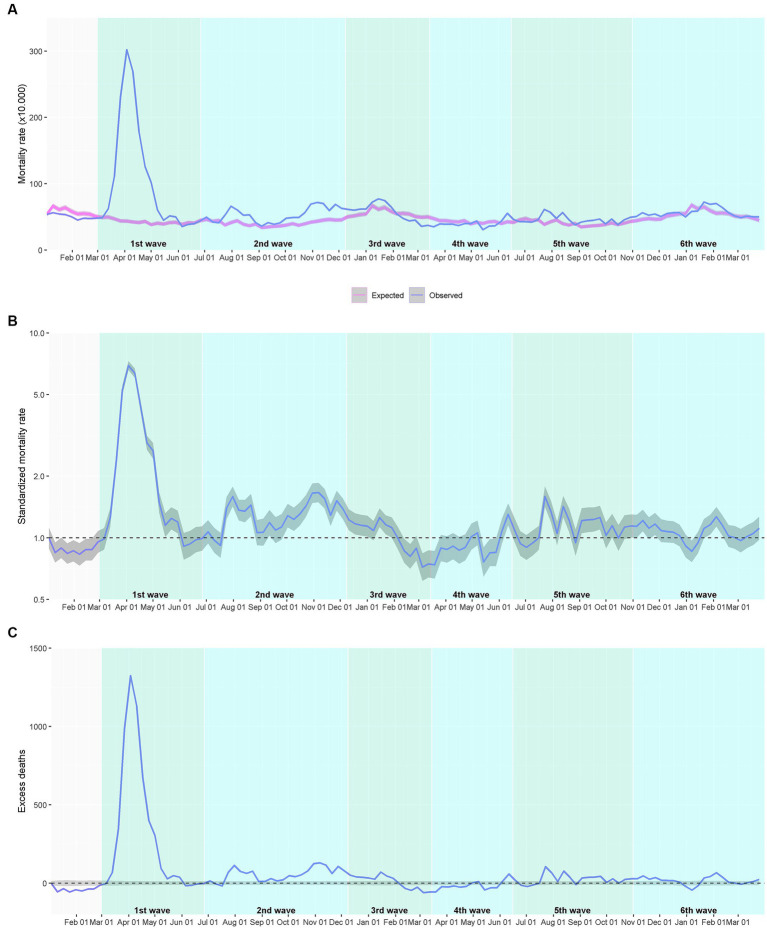
Figure 3.
Mortality among individuals aged ≥65 years institutionalized in a nursing home during the COVID-19 outbreak. (A) Expected and observed weekly mortality rate. (B) Standardized mortality rate (blue line) with the 95% confidence interval (grey area); the dotted line shows the neutrality. (C) Estimated weekly excess deaths; the dotted line shows the zero excess threshold. The analysis of the investigated period (2020–2021) corresponds to 123,522 person-years.

