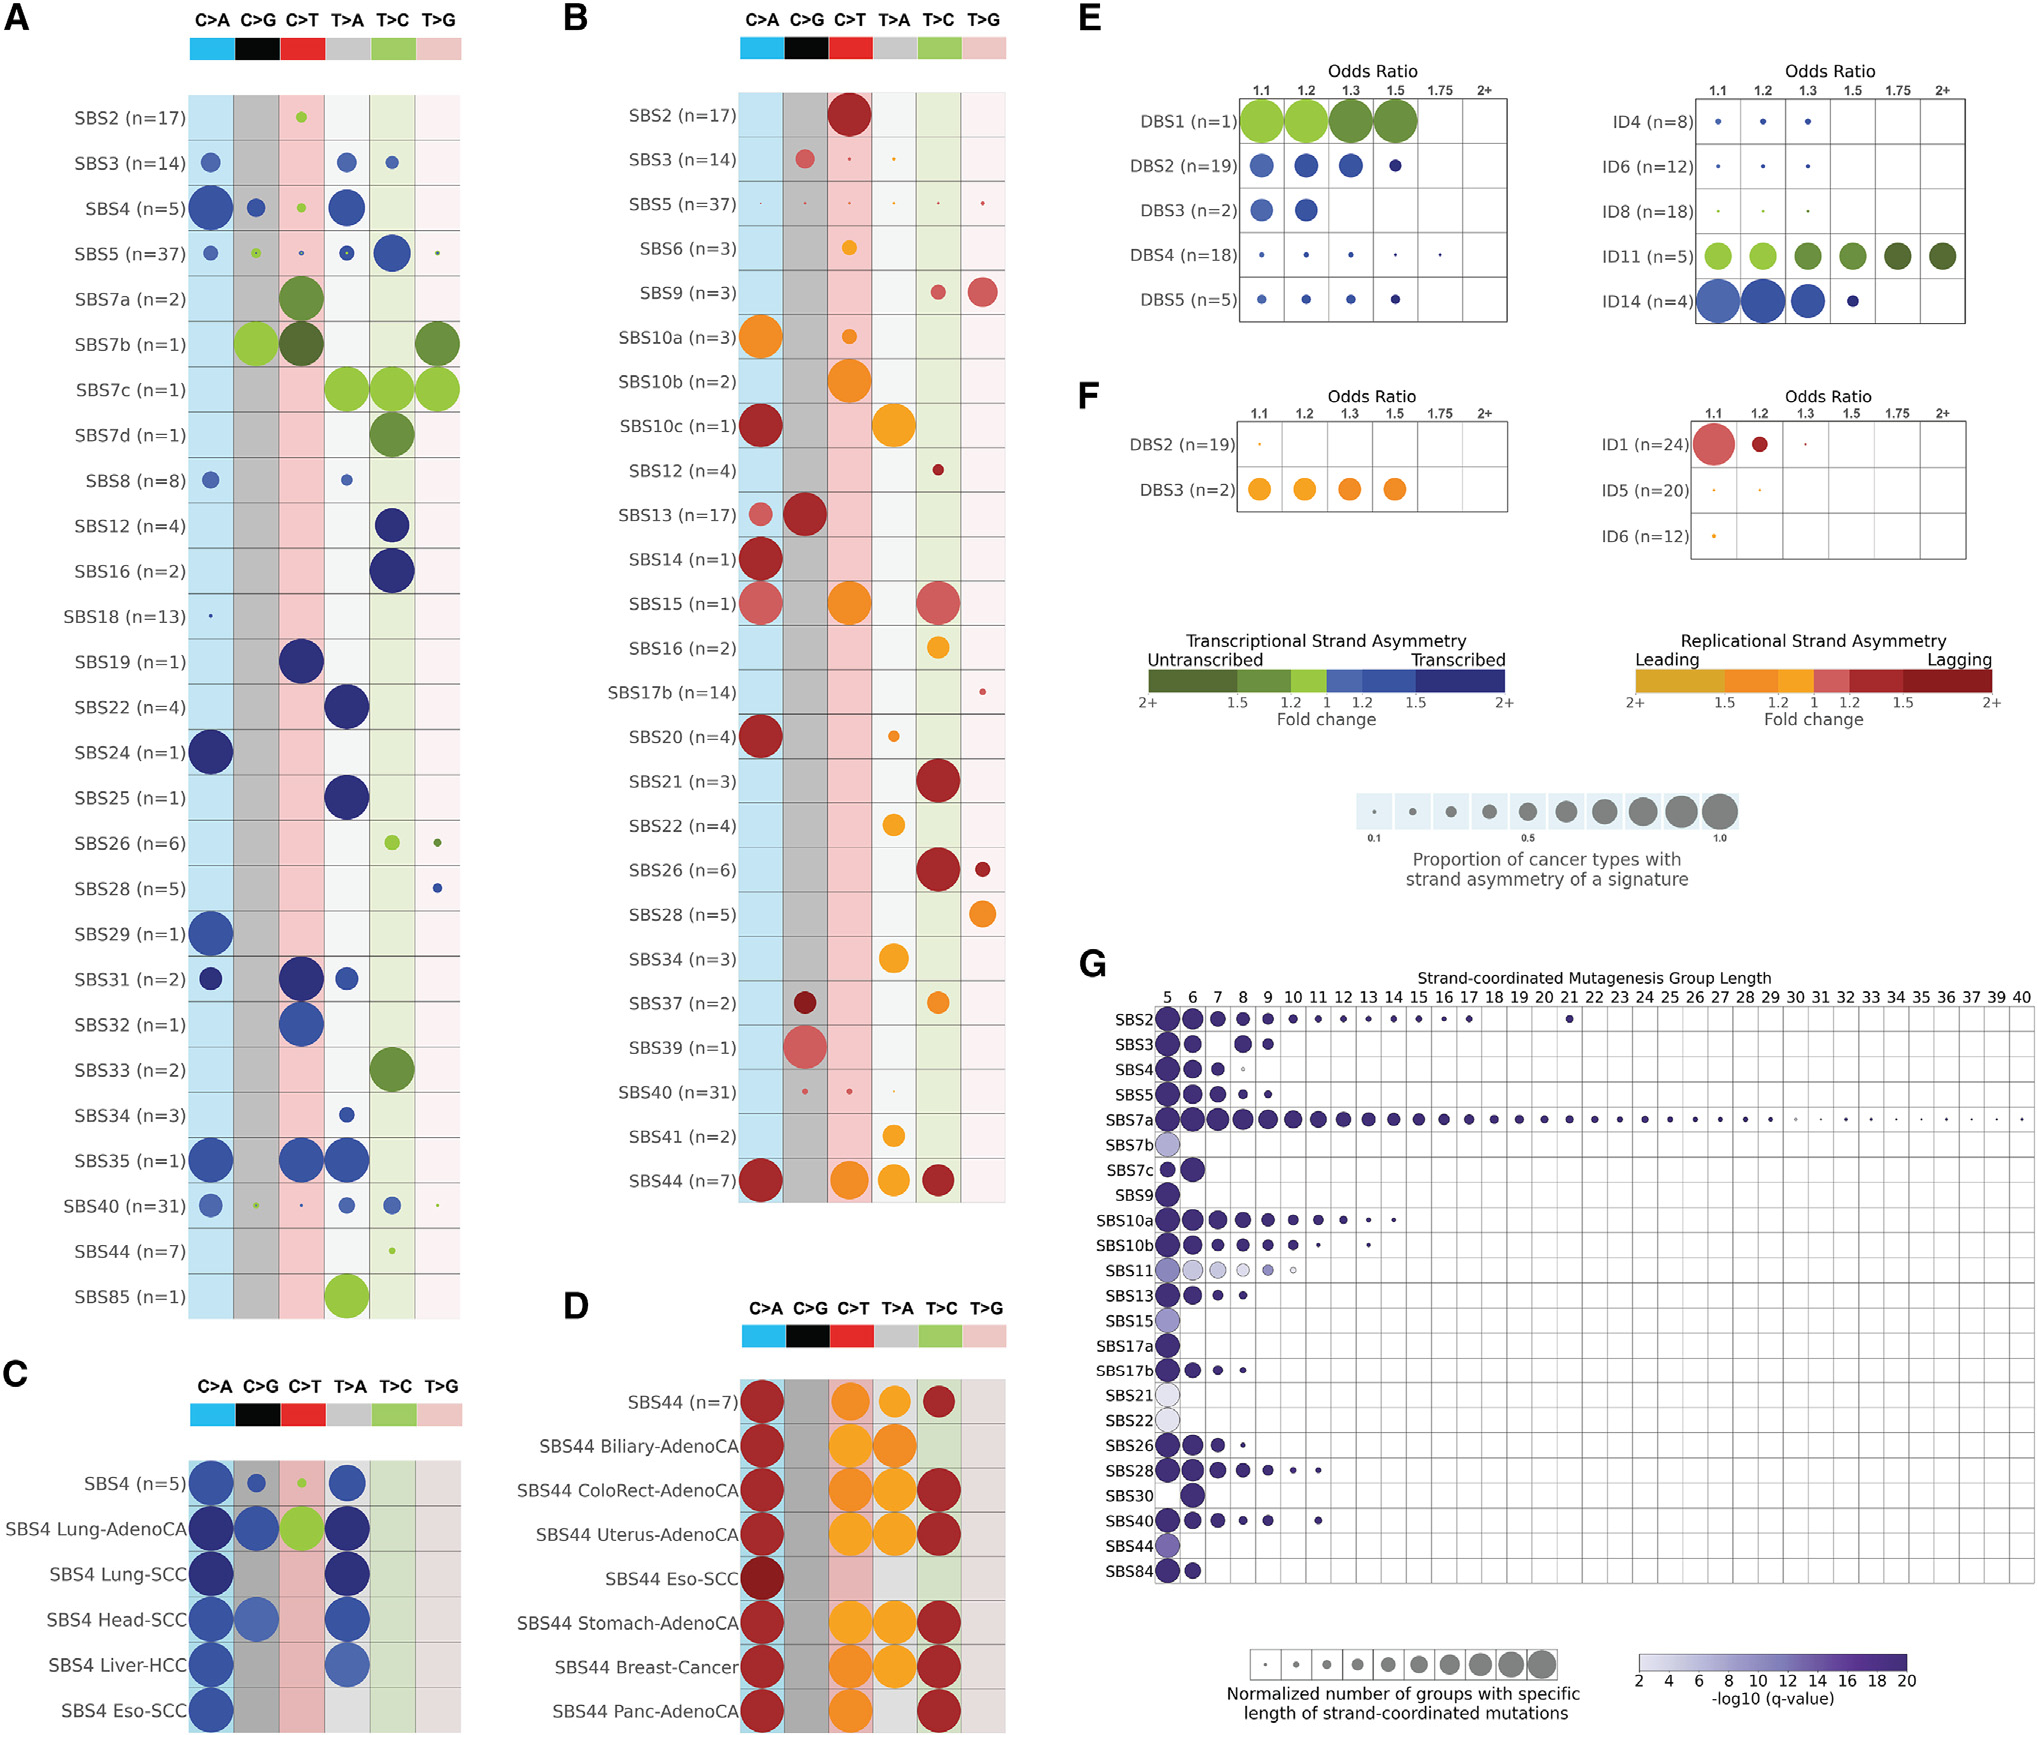
Figure 1. Strand asymmetries and strand-coordinated mutagenesis.

(A) Transcription strand asymmetries of signatures of single-base substitutions (SBSs). Rows represent the signatures, where n reflects the number of cancer types in which each signature was found. Columns display the six substitution subtypes based on the mutated pyrimidine base: C>A, C>G, C>T, T>A, T>C, and T>G. SBS signatures with transcription strand asymmetries on the transcribed and/or the untranscribed strands with adjusted p values ≤ 0.05 (Fisher’s exact test corrected for multiple testing using Benjamini-Hochberg) are shown in circles with blue and green colors, respectively. The color intensity reflects the odds ratio between the ratio of real mutations and the ratio of simulated mutations, where each ratio is calculated using the number of mutations on the transcribed strand and the number of mutations on the untranscribed strand. Only odds ratios above 1.10 are shown. Circle sizes reflect the proportion of cancer types exhibiting a signature with specific transcription strand asymmetry.
(B) Replication strand asymmetries of SBS signatures. Rows represent the signatures, where n reflects the number of cancer types in which each signature was found. Columns display the six substitution subtypes based on the mutated pyrimidine base: C>A, C>G, C>T, T>A, T>C, and T>G. SBS signatures with replicational strand asymmetries on the lagging strand or on the leading strand with adjusted p values ≤ 0.05 (Fisher’s exact test corrected for multiple testing using Benjamini-Hochberg) are shown in circles with red and yellow colors, respectively. The color intensity reflects the odds ratio between the ratio of real mutations and the ratio of simulated mutations, where each ratio is calculated using the number of mutations on the lagging strand and the number of mutations on the leading strand. Only odds ratios above 1.10 are shown. Circle sizes reflect the proportion of cancer types exhibiting a signature with specific replication strand asymmetry.
(C) Transcription strand asymmetries of signature SBS4 across cancer types. Data are presented in a format similar to the one in (A).
(D) Replication strand asymmetries of signature SBS44 across cancer types. Data are presented in a format similar to the one in (B).
(E) Transcription strand asymmetries of signatures of doublet-base substitutions (DBSs) and of small insertions or deletions (IDs). Data are presented in a format similar to the one in (A).
(F) Replication strand asymmetries of DBS and ID mutational signatures. Data are presented in a format similar to the one in (B).
(G) Strand-coordinated mutagenesis of SBS signatures. Rows represent SBS signatures and columns reflect the lengths, in numbers of consecutive mutations, of strand-coordinated mutagenesis groups. SBS signatures with statistically significant strand-coordinated mutagenesis (adjusted p values ≤ 0.05, z-test corrected for multiple testing using Benjamini-Hochberg) are shown as circles under the respective group length with a minimum length of 5 consecutive mutations. The size of each circle reflects the number of consecutive mutation groups for the specified group length normalized for each signature. The color of each circle reflects the statistical significance of the number of subsequent mutation groups for each group length with respect to simulated mutations.
See also Figure S1.
