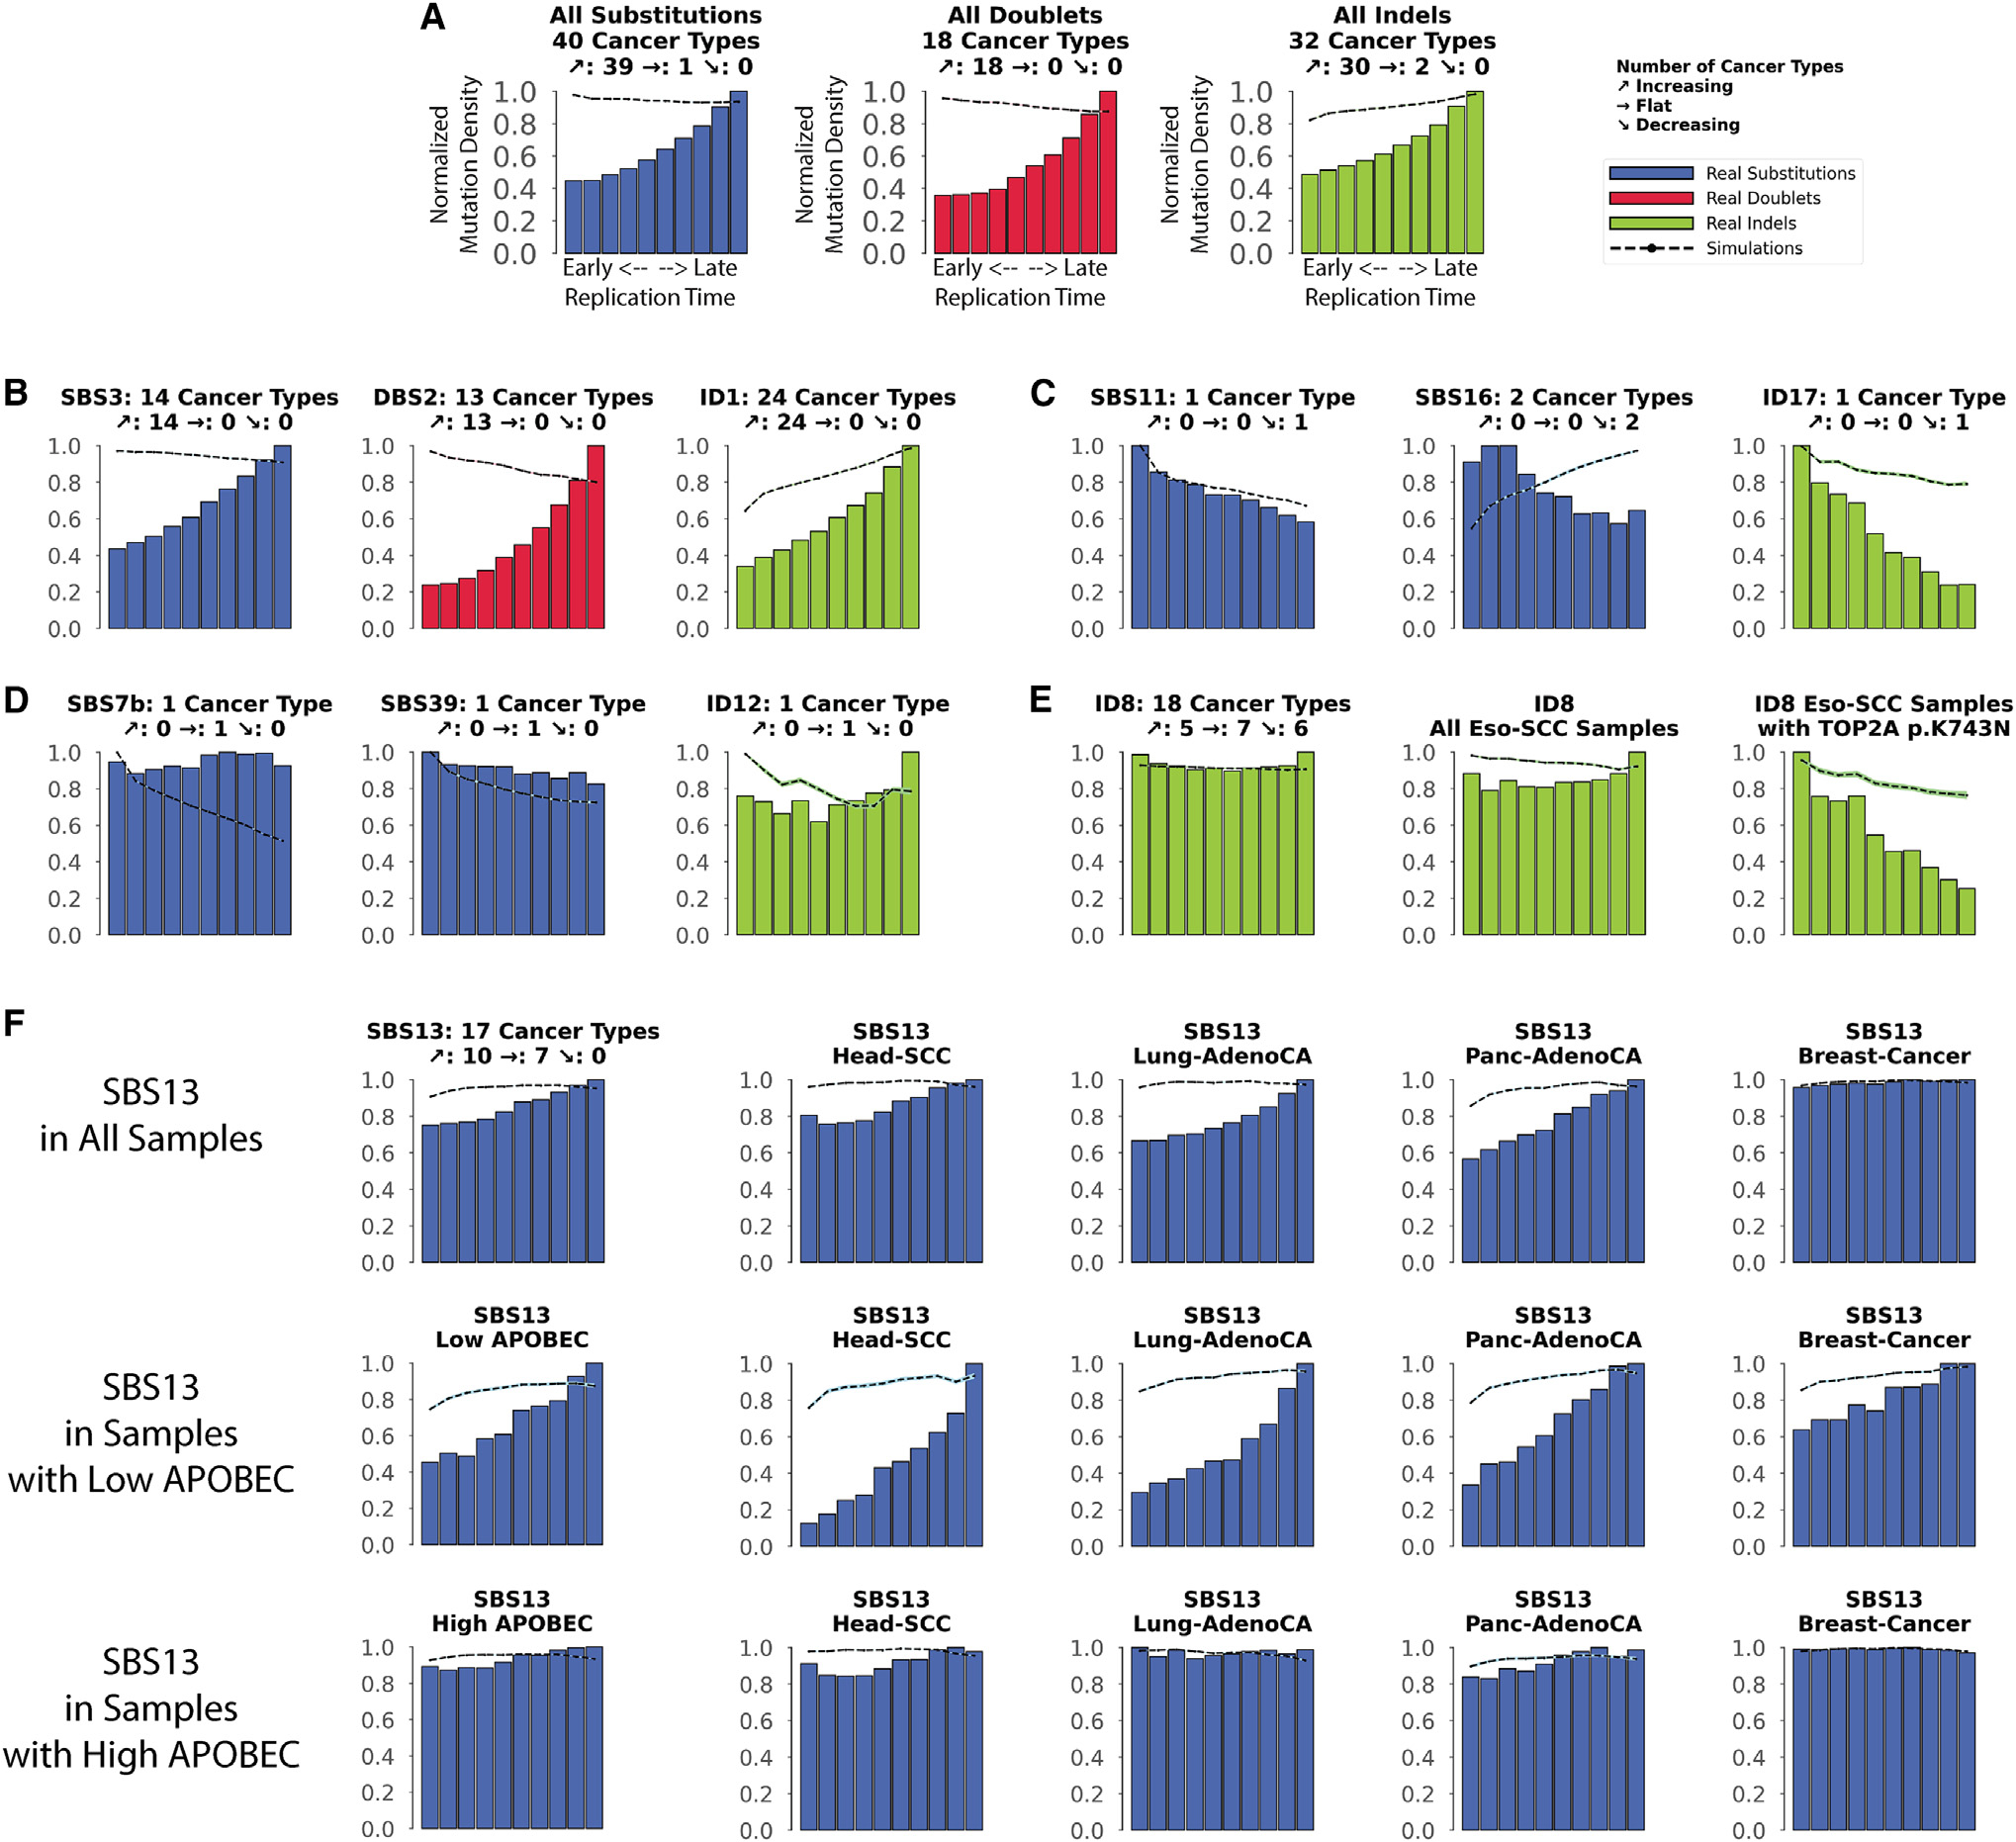
Figure 2. Interplay between replication timing and mutational signatures.

Replication time data are separated into deciles, with each segment containing exactly 10% of the observed replication time signal (x axes). Normalized mutation densities per decile (y axes) are presented for early (left) to late (right) replication domains. Real data for SBS signatures are shown as blue bars, for DBS signatures as red bars, and for small ID signatures as green bars. Simulated somatic mutations are shown as dashed lines. Where applicable, the total number of evaluated cancer types for a particular mutational signature is shown on top of each plot (e.g., 18 cancer types were evaluated for ID8 in E). For each signature, the number of cancer types where the mutation density increases with replication timing is shown next to the slanted up arrow (↗; e.g., 5 cancer types for ID8). Similarly, the number of cancer types where the mutation density decreases with replication timing is shown next to the slanted down arrow (↘; e.g., 6 cancer types for ID8). Lastly, the number of cancer types where the mutation density is not affected by replication timing is shown next to the right-pointing arrow (→ e.g., 7 cancer types for ID8).
(A) All SBSs, DBSs, and IDs across all examined cancer types with each cancer type examined separately.
(B) Exemplar signatures consistently associated with late replication timing.
(C) Exemplar signatures consistently associated with early replication timing.
(D) Exemplar signatures consistently unaffected by replication timing.
(E) ID8 as a mutational signature inconsistently affected by replication timing.
(F) The effect of replication timing on APOBEC3-associated signature SBS13 in samples with low and high APOBEC3 mutational burden.
See also Figure S2.
