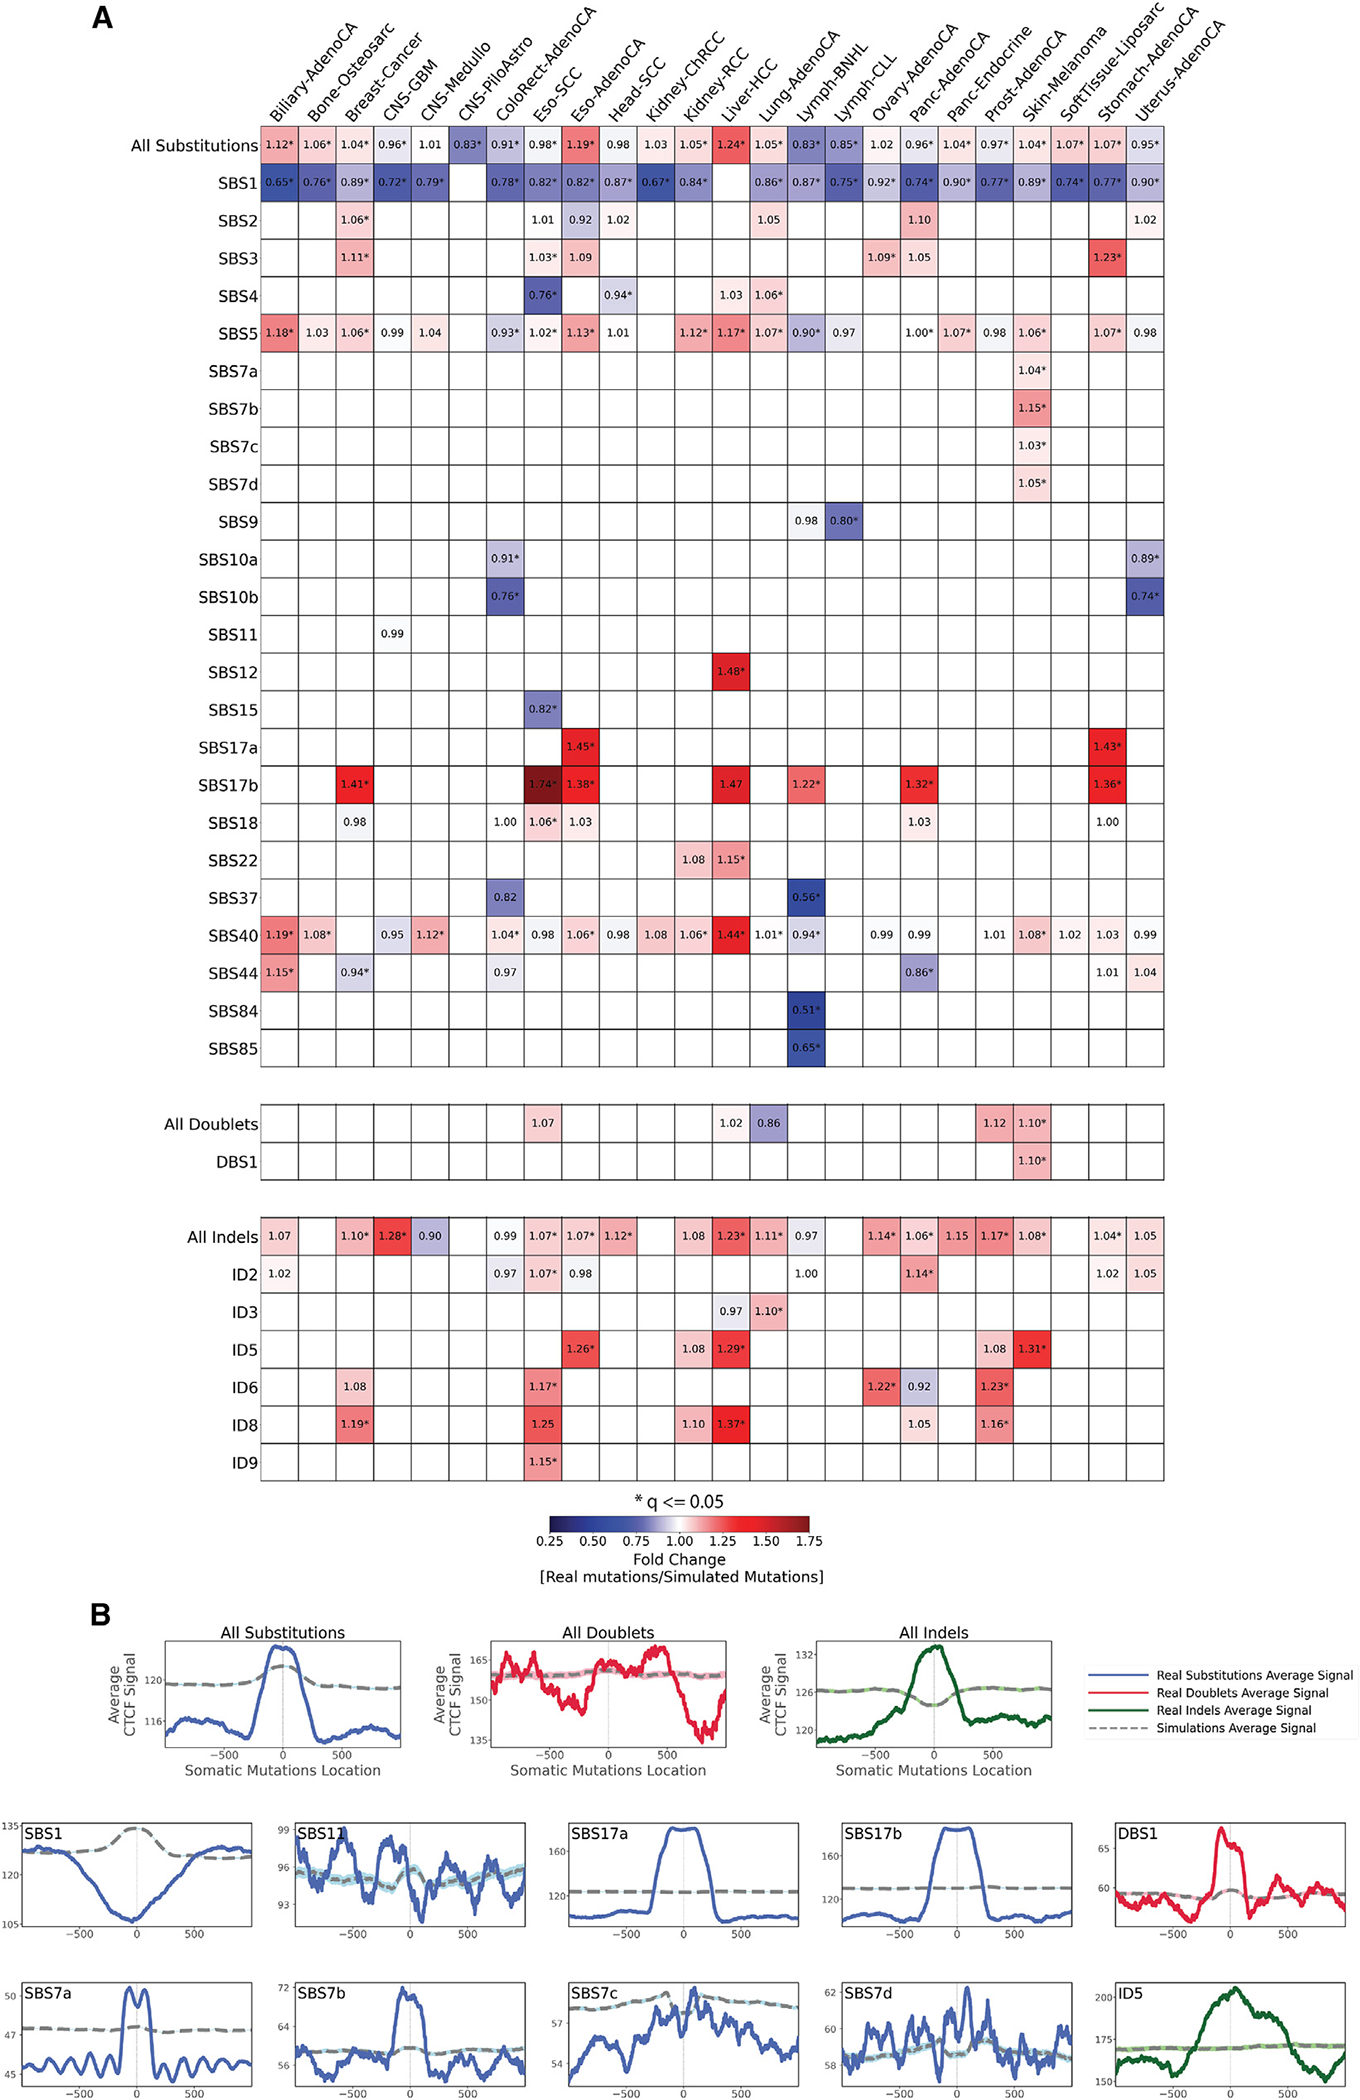
Figure 4. Relationship between mutational signatures and CTCF binding sites.

(A) Enrichments and depletions of somatic mutations within CTCF binding sites. Heatmaps display only mutational signatures and cancer types that have at least one statistically significant enrichment or depletion of somatic mutations attributed to signatures of either SBSs, DBSs, or small IDs. Red colors correspond to enrichments of real somatic mutations when compared to simulated data. Blue colors correspond to depletions of real somatic mutations when compared to simulated data. The intensities of red and blue colors reflect the degree of enrichments or depletions based on the fold change. White colors correspond to lack of data for performing statistical comparisons (e.g., signature not being detected in a cancer type). Statistically significant enrichments and depletions are annotated with an asterisk (*; adjusted p value ≤ 0.05, z-test combined with Fisher’s method and corrected for multiple testing using Benjamini-Hochberg).
(B) The top three panels reflect average CTCF occupancy signal for all SBSs, DBS, and IDs across all examined cancer types. Bottom panels reflect all somatic mutations attributed for several exemplar mutational signatures across all cancer types. In all cases, solid lines correspond to real somatic mutations, with blue solid lines reflecting SBSs, red solid lines reflecting DBSs, and green solid lines reflecting IDs. Solid lines and dashed lines display the average CTCF binding signal (y axes) along a 2 kb window (x axes) centered at the mutation start site for real and simulated mutations, respectively. The mutation start site is annotated in the middle of each plot and denoted as 0. The 2 kb window encompasses 1,000 base pairs 5′ adjacent to each mutation as well as 1,000 base pairs 3′ adjacent to each mutation.
