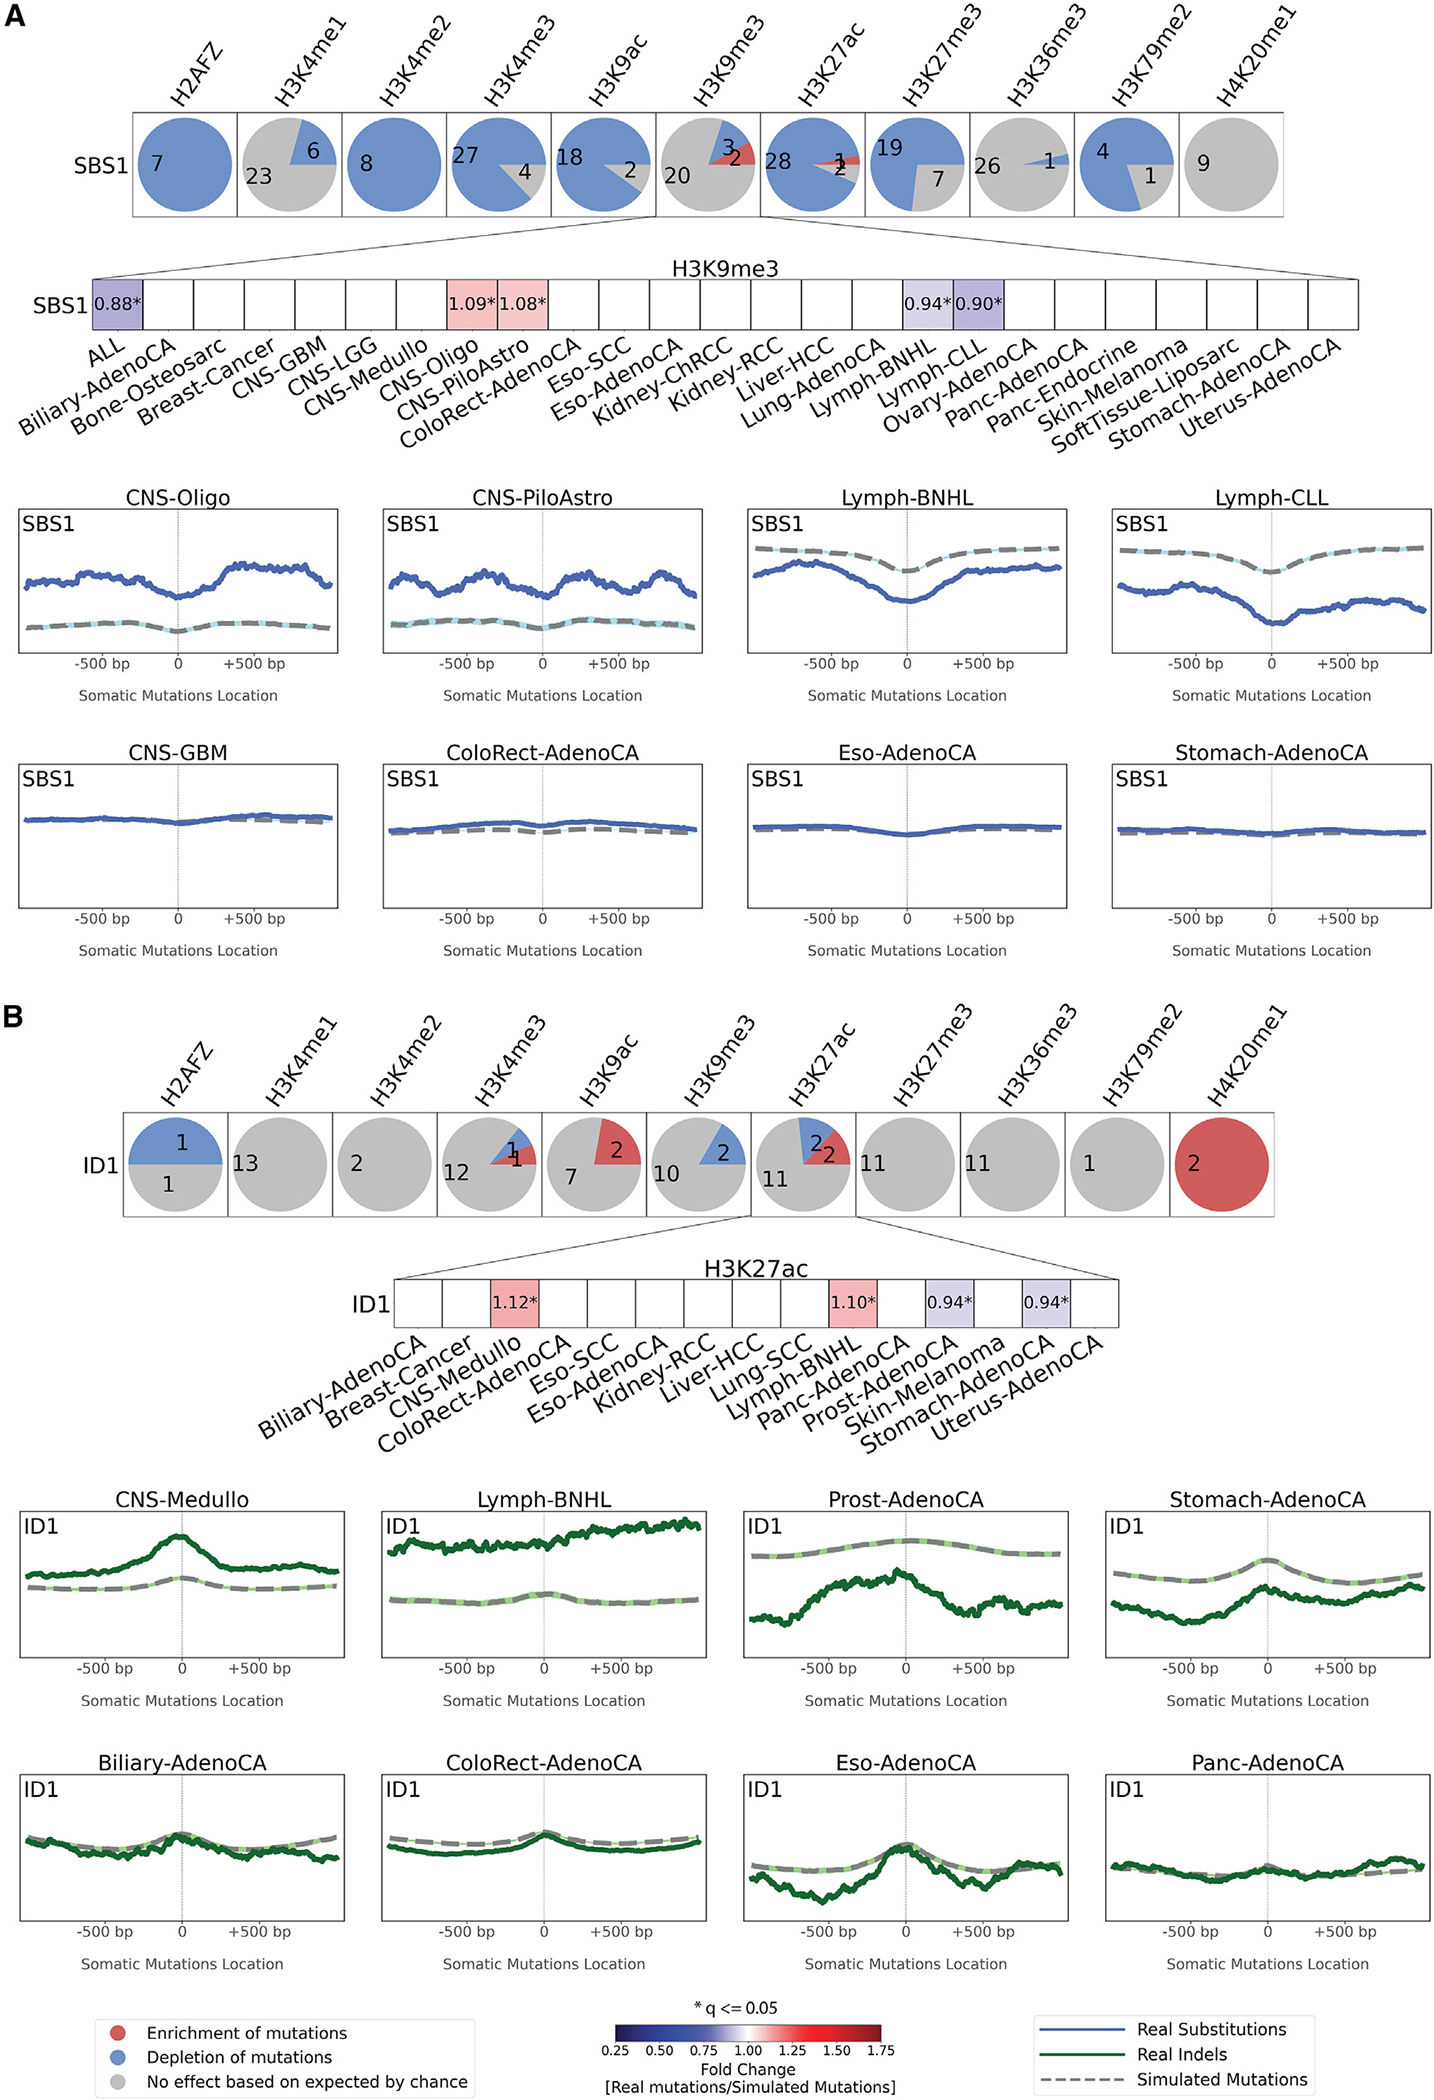
Figure 5. Exemplar relationships between mutational signatures and histone modifications.

The effect of histone modifications is shown for signatures SBS1 (A) and ID1 (B). For each signature, an evaluation was made for each of the 11 histone marks across all cancer types with sufficient numbers of somatic mutations with results presented as circles. Each circle is separated in red, blue, and gray segments proportional to the cancer types in which the signature has a specific behavior. A red segment in a circle reflects the signature being enriched in the vicinity of a histone modification (adjusted p value ≤ 0.05, z-test combined with Fisher’s method and corrected for multiple testing using Benjamini-Hochberg and at least 5% enrichment). A blue segment in a circle reflects the signature being depleted in the vicinity of a histone modification (adjusted p value ≤ 0.05, z-test combined with Fisher’s method and corrected for multiple testing using Benjamini-Hochberg and at least 5% depletion). A gray segment in a circle corresponds to neither depletion nor enrichment of the signature in the vicinity of a histone modification. The figure zooms in on the effect of H3K9me3 on SBS1 (A) and of H3K27ac on ID1 (B). Red colors correspond to enrichments of real somatic mutations when compared to simulated data. Blue colors correspond to depletions of real somatic mutations when compared to simulated data. The intensities of red and blue colors reflect the degree of enrichments or depletions based on the fold change. We further zoom in on the patterns of mutations around H3K9me3 and H3K27ac. Solid lines correspond to real somatic mutations, with blue solid lines reflecting SBSs and green solid lines reflecting IDs. Solid lines and dashed lines display the average histone mark signal (y axes) along a 2 kb window (x axes) centered at the mutation start site for real and simulated mutations, respectively. The mutation start site is annotated in the middle of each plot and denoted as 0. The 2 kb window encompasses 1,000 base pairs 5′ adjacent to each mutation as well as 1,000 base pairs 3′ adjacent to each mutation.
See also Figure S4.
