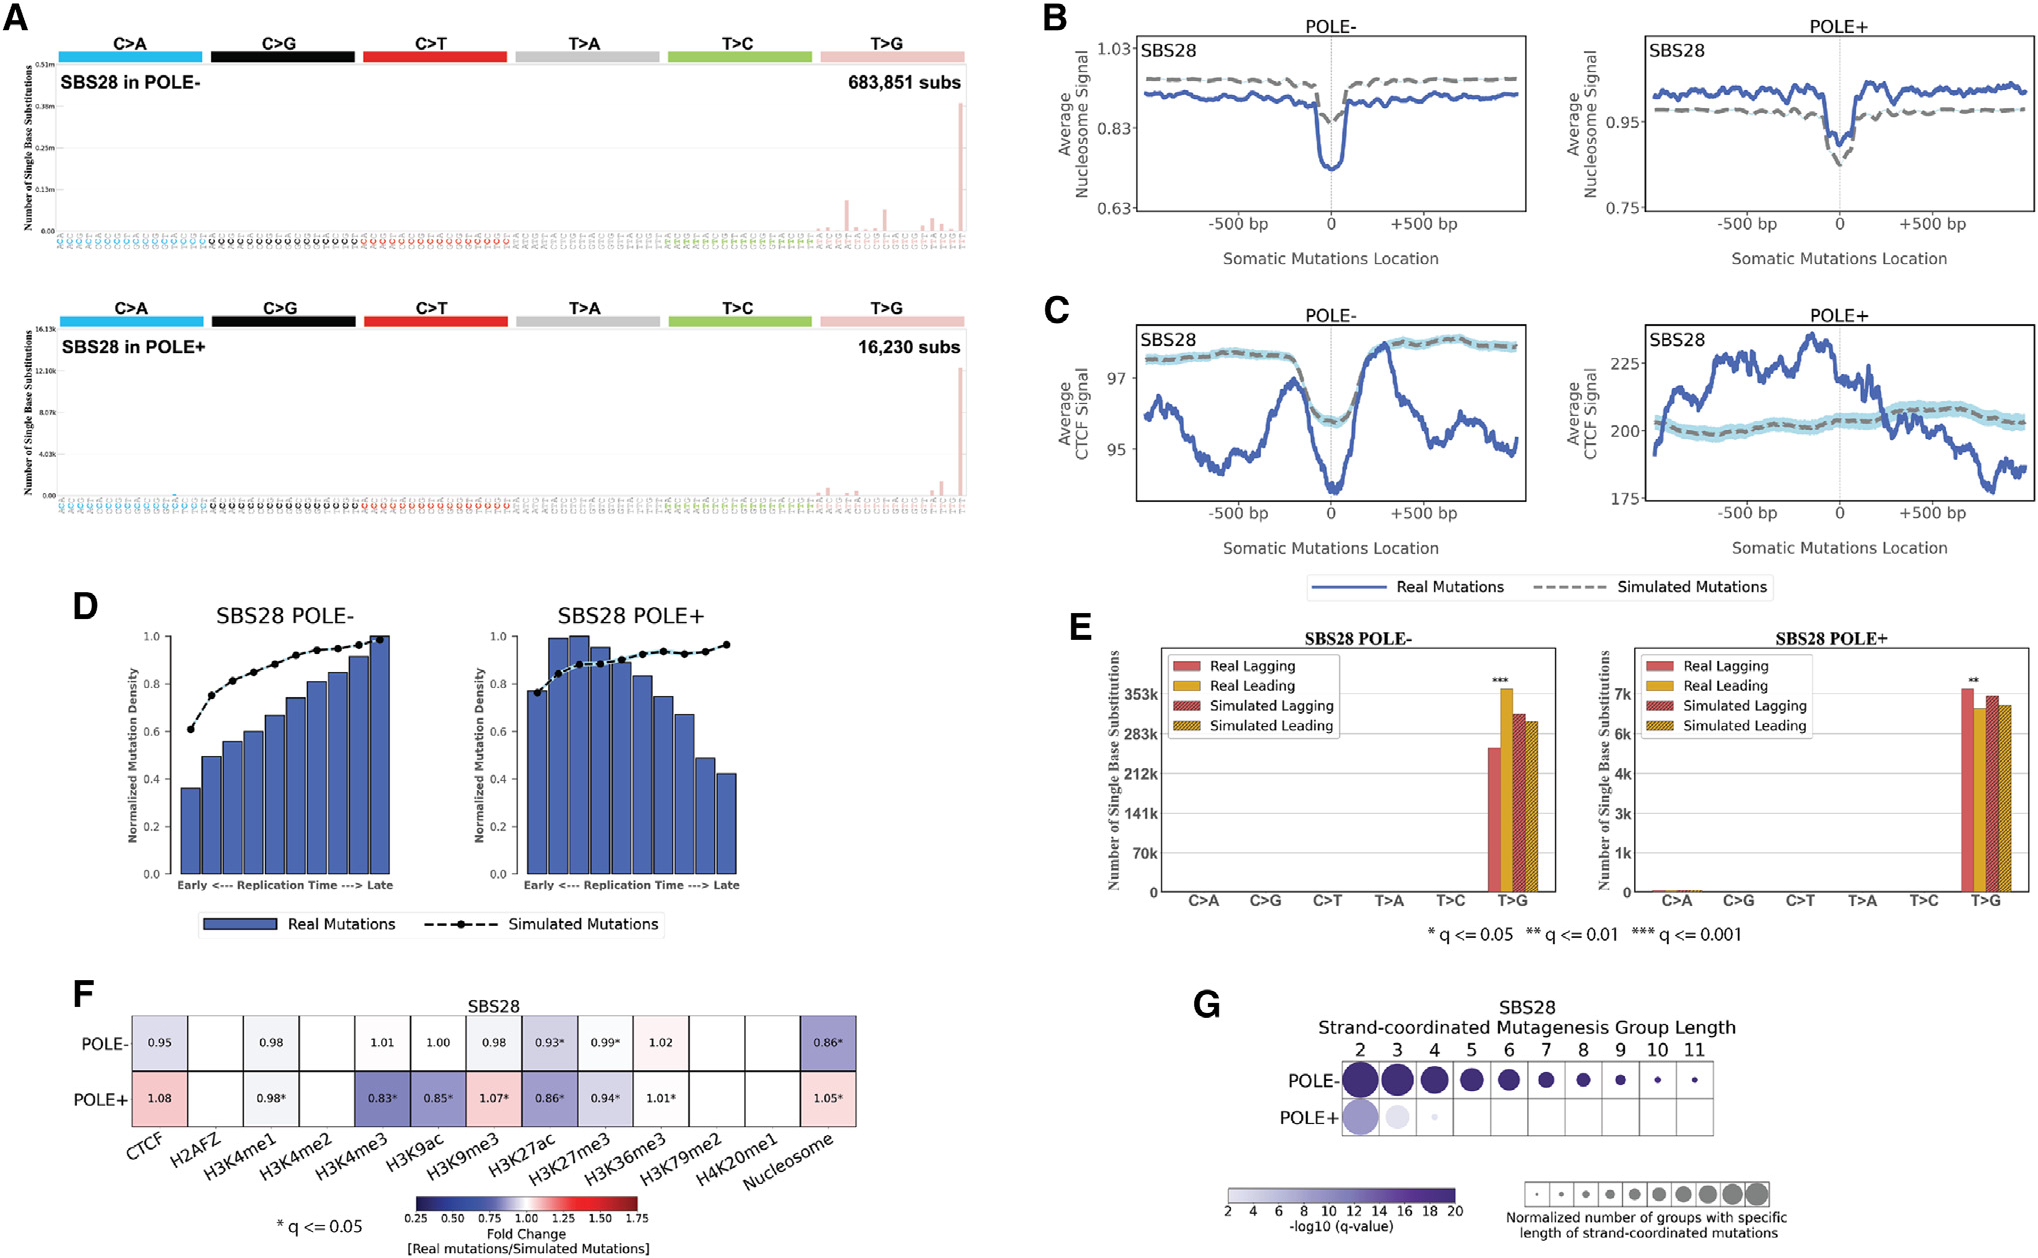
Figure 6. Topography of signature SBS28 in POLE-deficient (POLE−) and POLE-proficient (POLE+) samples.

(A) Mutational patterns of signature SBS28 in POLE− and POLE+ samples displayed using the conventional 96 mutational classification schema for SBSs.
(B) Nucleosome occupancy of SBS28 in POLE and POLE+ samples. Blue solid lines and gray dashed lines display the average nucleosome signal (y axes) along a 2 kb window (x axes) centered at the mutation start site for real and simulated mutations, respectively. The mutation start site is annotated in the middle of each plot and denoted as 0. The 2 kb window encompasses 1,000 base pairs 5′ adjacent to each mutation as well as 1,000 base pairs 3′ adjacent to each mutation.
(C) CTCF occupancy of SBS28 in POLE− and POLE+ samples. Blue solid lines and gray dashed lines display the average CTCF binding signal (y axes) along a 2 kb window (x axes) centered at the mutation start site for real and simulated mutations, respectively. The mutation start site is annotated in the middle of each plot and denoted as 0. The 2 kb window encompasses 1,000 base pairs 5′ adjacent to each mutation as well as 1,000 base pairs 3′ adjacent to each mutation.
(D) Replication timing of SBS28 mutations in POLE− and POLE+ samples. Replication time data are separated into deciles, with each segment containing exactly 10% of the observed replication time signal (x axes). Normalized mutation densities per decile (y axes) are presented for early (left) to late (right) replication domains. Normalized mutation densities of real somatic mutations and simulated somatic mutations from early- to late-replicating regions are shown as blue bars and dashed lines, respectively.
(E) Replication strand asymmetry of SBS28 mutations in POLE− and POLE+ samples. Bar plots display the number of mutations accumulated on the lagging strand and on the leading strand for six substitution subtypes based on the mutated pyrimidine base C>A, C>G, C>T, T>A, T>C, and T>G in red and yellow colors, respectively. Simulated mutations on lagging and leading strands are displayed in shaded bar plots. Statistically significant strand asymmetries are shown with stars: adjusted p values: *p ≤ 0.05; **p ≤ 0.01; ***p ≤ 0.001 (Fisher’s exact test corrected for multiple testing using Benjamini-Hochberg).
(F) Enrichments and depletions of SBS28 somatic mutations in POLE− and POLE+ samples within CTCF binding sites, histone modifications, and nucleosome occupied regions. Red colors correspond to enrichments of real somatic mutations when compared to simulated data. Blue colors correspond to depletions of real somatic mutations when compared to simulated data. The intensities of red and blue colors reflect the degree of enrichments or depletions based on the fold change. White colors correspond to lack of data for performing statistical comparisons. Statistically significant enrichments and depletions are annotated with an asterisk (*; adjusted p value ≤ 0.05, z-test combined with Fisher’s method and corrected for multiple testing using Benjamini-Hochberg).
(G) Strand-coordinated mutagenesis of SBS28 mutations in POLE− and POLE+ samples. Rows represent SBS28 signature in POLE− and POLE+ samples across all cancer types and columns reflect the lengths, in numbers of consecutive mutations, of strand-coordinated mutagenesis groups. Statistically significant strand-coordinated mutagenesis (adjusted p value ≤ 0.05, z-test corrected for multiple testing using Benjamini-Hochberg) are shown as circles under the respective group length with a length starting from 2 to 11 consecutive mutations. The size of each circle reflects the number of consecutive mutation groups for the specified group length normalized for each SBS28 signature in POLE− and POLE+ samples. The color of each circle reflects the statistical significance of the number of subsequent mutation groups for each group length with respect to the simulated mutations using −log10 (q value).
