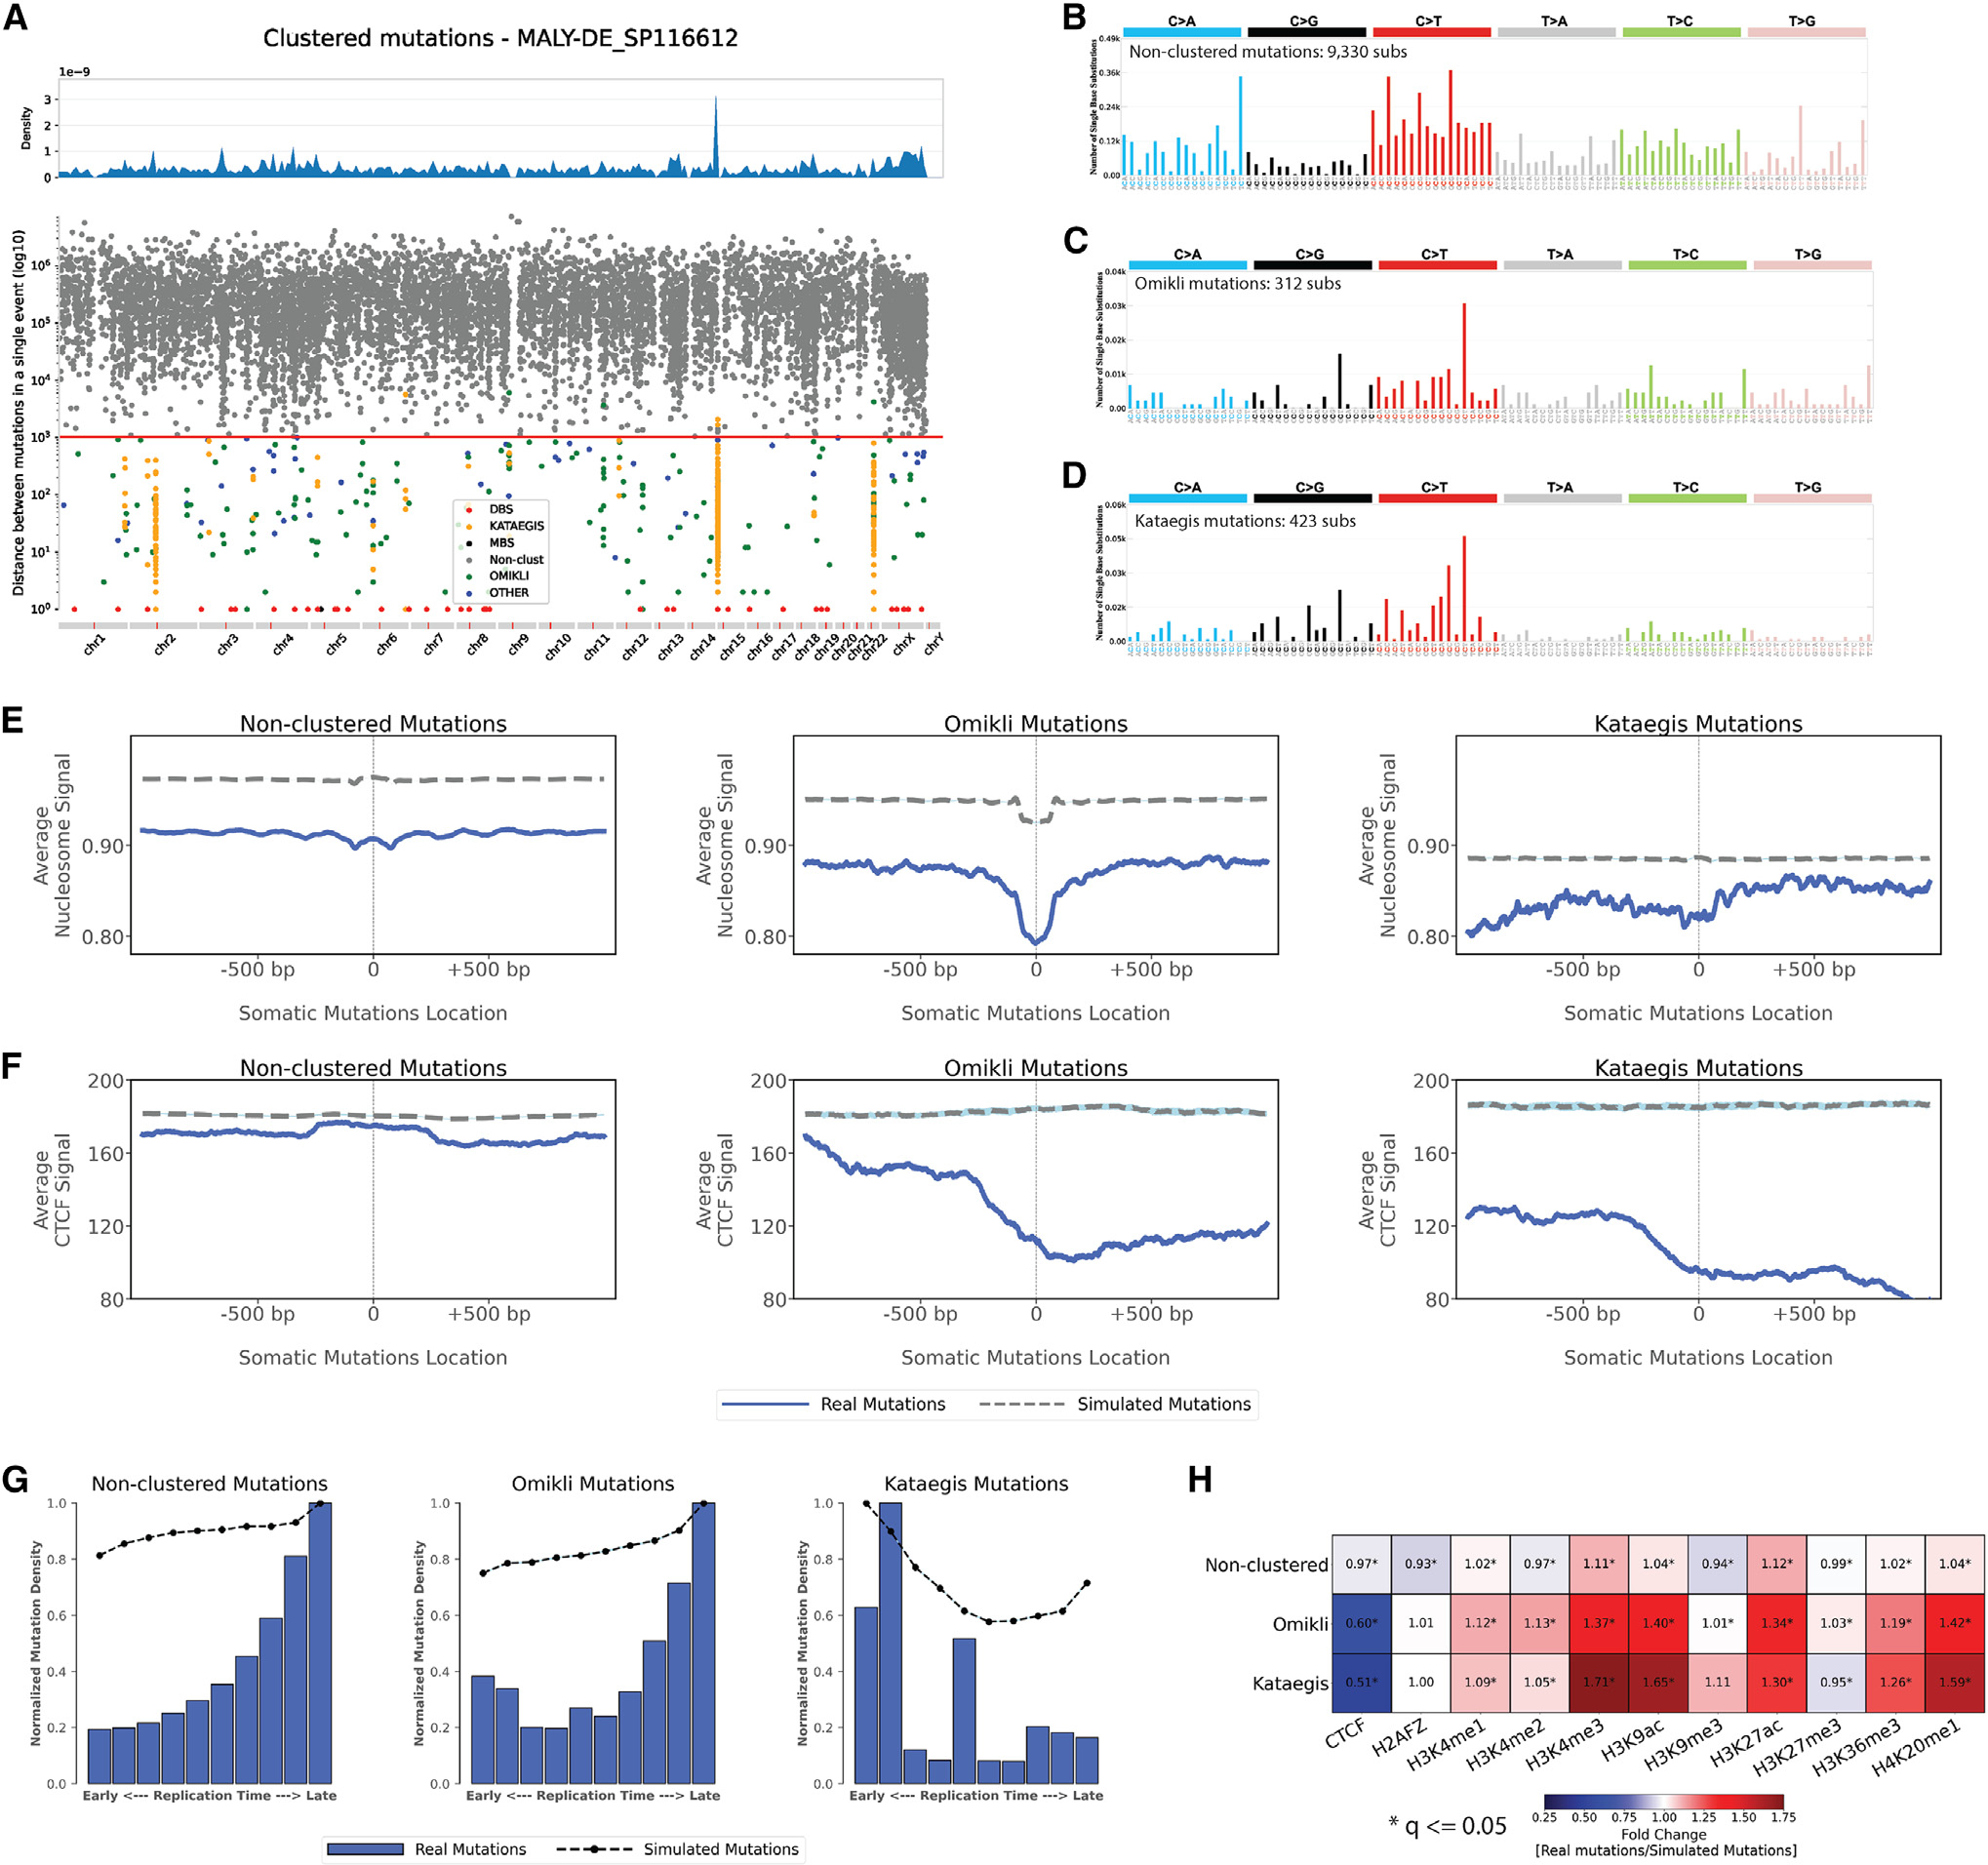
Figure 7. Topography of non-clustered, omikli, and kataegis substitutions across 288 whole-genome-sequenced B cell malignancies.

(A) A rainfall plot of an example B cell malignancy sample, MALY-DE_SP116612, depicting the intra-mutational distance (IMD) distributions of substitutions across genomic coordinates. Each dot represents the minimum distance between two adjacent mutations. Dots are colored based on their corresponding classifications. Specifically, non-clustered mutations are shown in gray, DBSs in red, multi-base substitutions (MBSs) in black, omikli events in green, kataegis events in orange, and all other clustered events in blue. The red line depicts the sample-dependent IMD threshold for each sample. Specific clustered mutations may be above this threshold due to corrections for regional mutation density.
(B–D) The trinucleotide mutational spectra for the different catalogs of non-clustered, omikli, and kataegis mutations for the exemplar sample (DBSs and MBSs are not shown).
(E) Nucleosome occupancy of non-clustered, omikli, and kataegis mutations of B cell malignancies. Blue solid lines and gray dashed lines display the average nucleosome signal (y axes) along a 2 kb window (x axes) centered at the mutation start site for real and simulated mutations, respectively. The mutation start site is annotated in the middle of each plot and denoted as 0. The 2 kb window encompasses 1,000 base pairs 5′ adjacent to each mutation as well as 1,000 base pairs 3′ adjacent to each mutation.
(F) CTCF occupancy of non-clustered, omikli, and kataegis mutations of B cell malignancies. Blue solid lines and gray dashed lines display the average CTCF signal (y axes) along a 2 kb window (x axes) centered at the mutation start site for real and simulated mutations, respectively. The mutation start site is annotated in the middle of each plot and denoted as 0. The 2 kb window encompasses 1,000 base pairs 5′ adjacent to each mutation as well as 1,000 base pairs 3′ adjacent to each mutation.
(G) Replication timing of non-clustered, omikli, and kataegis mutations of B cell malignancies. Replication time data are separated into deciles, with each segment containing exactly 10% of the observed replication time signal (x axes). Normalized mutation densities per decile (y axes) are presented for early (left) to late (right) replication domains. Normalized mutation densities of real somatic mutations and simulated somatic mutations from early- to late-replicating regions are shown as blue bars and dashed lines, respectively.
(H) Enrichments and depletions of non-clustered, omikli, and kataegis mutations of B cell malignancies within CTCF binding sites and histone modifications. Red colors correspond to enrichments of real somatic mutations when compared to simulated data. Blue colors correspond to depletions of real somatic mutations when compared to simulated data. The intensities of red and blue colors reflect the degree of enrichments or depletions based on the fold change. White colors correspond to lack of data for performing statistical comparisons. Statistically significant enrichments and depletions are annotated with an asterisk (*; adjusted p value ≤0.05, z-test combined with Fisher’s method and corrected for multiple testing using Benjamini-Hochberg).
See also Figure S5.
