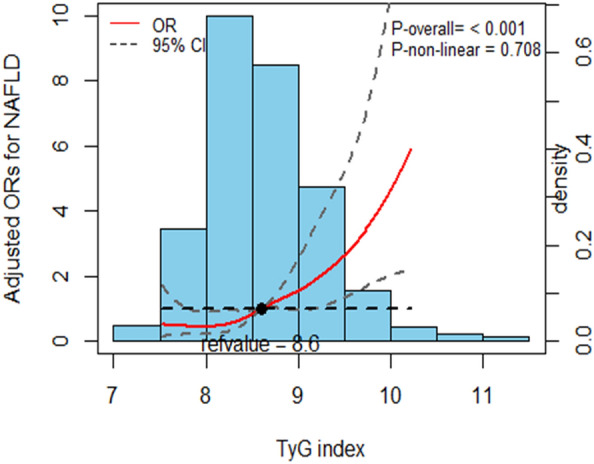
Fig. 3.

NAFLD prevalence distribution odds ratio and histogram based on TyG index. The red curve with the light black dashed line represents the adjusted odds ratio for the prevalence of NAFLD based on the TyG index, with a 95% CI of 8.6. The cubic spline in the model has 3 knots. Adjustment factors include age, gender, AF type, dyslipidemia, diabetes, BMI, eGFR, AST, ALT, HDL-C, UA, duration of AF, hypertension, and smoking. NAFLD non-alcoholic fatty liver disease, 95% CI 95% confidence interval, OR odds ratio, TyG triglyceride–glucose, BMI body mass index, eGFR estimated glomerular filtration rate, AST aspartate aminotransferase, ALT alanine aminotransferase, HDL-C high-density lipoprotein cholesterol, UA uric acid
