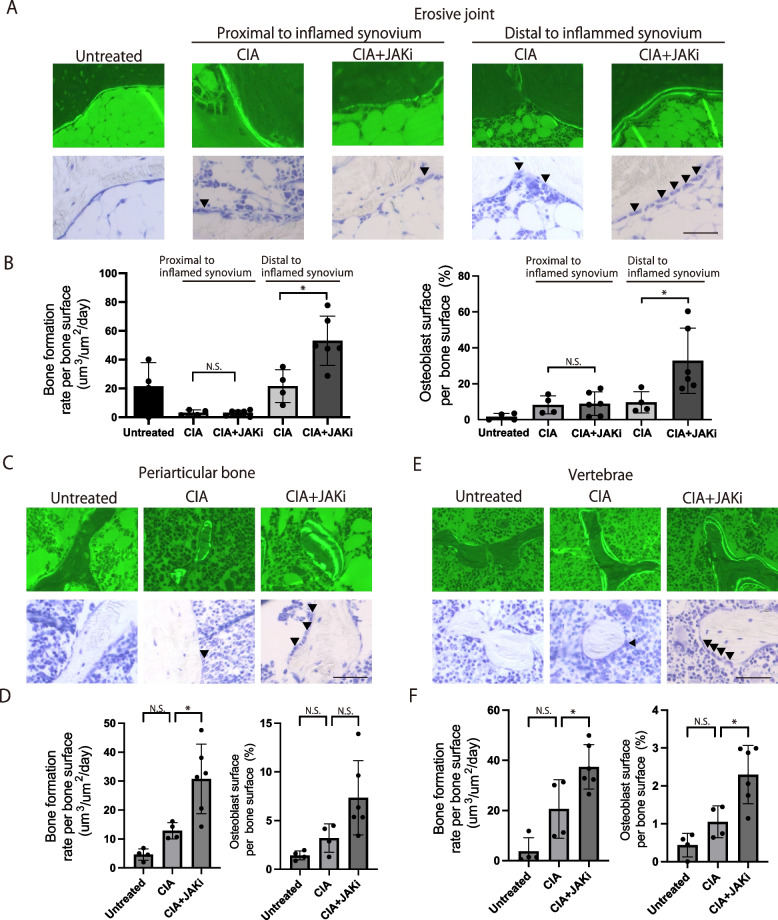
Fig. 3.
The effect of the JAK inhibitor on osteoblastic bone formation in the three types of bone damage in autoimmune arthritis. A, B Representative calcein labeling (A, upper), toluidine blue staining (A, lower), bone formation rate (B, left) and osteoblast surface per bone surface of the calcaneus of untreated (n = 4), CIA (n = 4), and CIA + JAKi mice (n = 6). The calcaneus proximal and distal to inflamed synovium were investigated. C, D Representative calcein labeling (C, upper), toluidine blue staining (C, lower), bone formation rate (D, left), and osteoblast surface per bone surface of the periarticular bone (proximal tibia, D, right) of untreated (n = 4), CIA (n = 4), and CIA + JAKi mice (n = 6). E, F Representative calcein labeling (E, upper), toluidine blue staining (F, lower), bone formation rate (F, left) and osteoblast surface per bone surface of the lumbar vertebrae (F, right) of untreated (n = 4), CIA (n = 4), and CIA + JAKi mice (n = 6). Scale bar: (50 μm) (A, C, E). The arrowheads show osteoblasts. All data are expressed as the mean ± SEM. *P < 0.05; by one-way ANOVA with the Holm-Sidak multiple comparisons test (B, D, F) N.S., not significant

