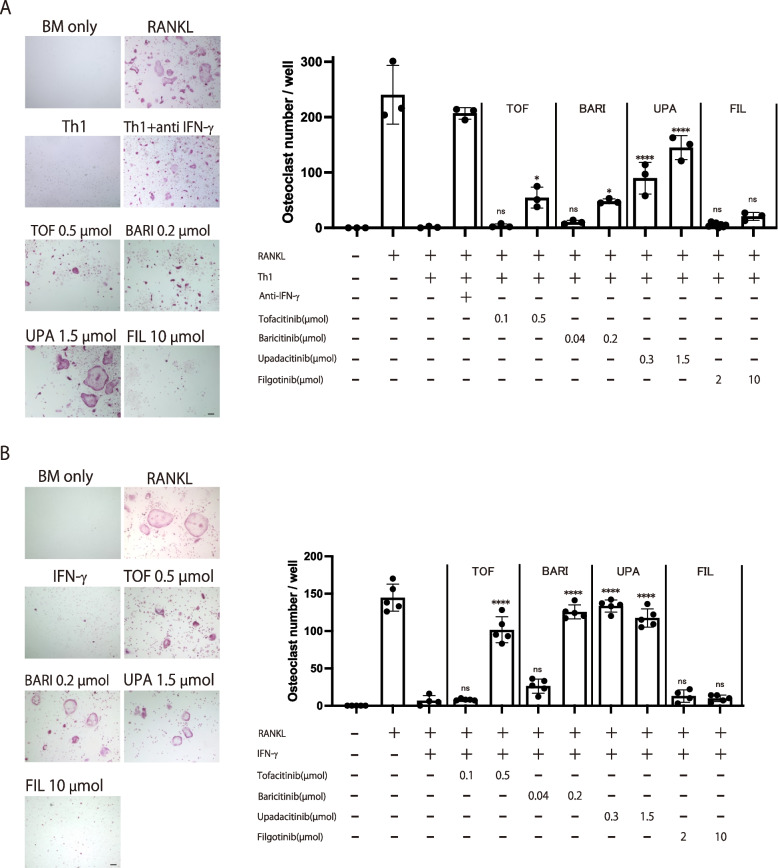
Fig. 5.
The effects of the various JAK inhibitors on osteoclastogenesis in a RANKL-induced osteoclast formation system cocultured with Th1 cells. A Representative TRAP staining (left) and number of TRAP+ multinucleated cells (right) in the presence of the respective JAK inhibitor in the RANKL-induced osteoclast formation system cocultured with Th1 cells. B Representative TRAP staining (left) and number of TRAP+ multinucleated cells (right) in the presence of the respective JAK inhibitor and IFN-γ in the RANKL-induced osteoclast formation system. Scale bar: (100 µm). All data are expressed as the mean ± SEM. *P < 0.05, ****p < 0.0001; by one-way ANOVA with the Holm-Sidak’s multiple comparisons test

