Fig. 6.
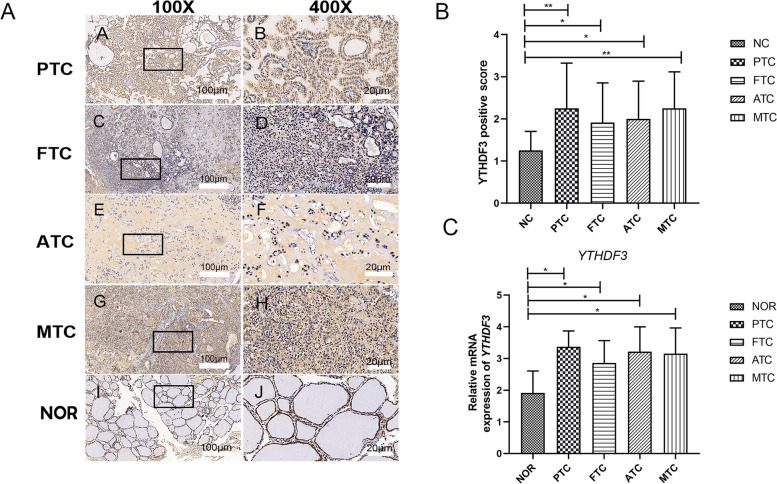
Immunohistochemistry and q-PCR verified the expression level of YTHDF3 between TC and normal tissues. A Immunohistochemical expression of YTHDF3 on TC (PTC, FTC, ATC, MTC) tissues. The brown area in Fig. 6A marked the positive staining of YTHDF3 in tumor tissues. The scale bar is located in the lower right corner of each group of images, with a scale of 100 μm under 100x microscope and 20 μm under 400x microscope. B The quantification of immunohistochemistry based on positive area score. C The expression levels of YTHDF3 mRNA in human PTC, FTC, ATC and MTC cell and the normal thyroid follicular epithelial cell were analyzed by q-PCR. The data represents the mean ± S.E.M. (* p < 0.05, **p < 0.01, ***p < 0.001). The human PTC cell line K1, human FTC cell line FTC-238, human ATC cell line 8305 C, human MTC cells TT and normal human thyroid follicular epithelial cell line Nthy-ori3-1 were used in q-PCR. (* p < 0.05, **p < 0.01, ***p < 0.001)

