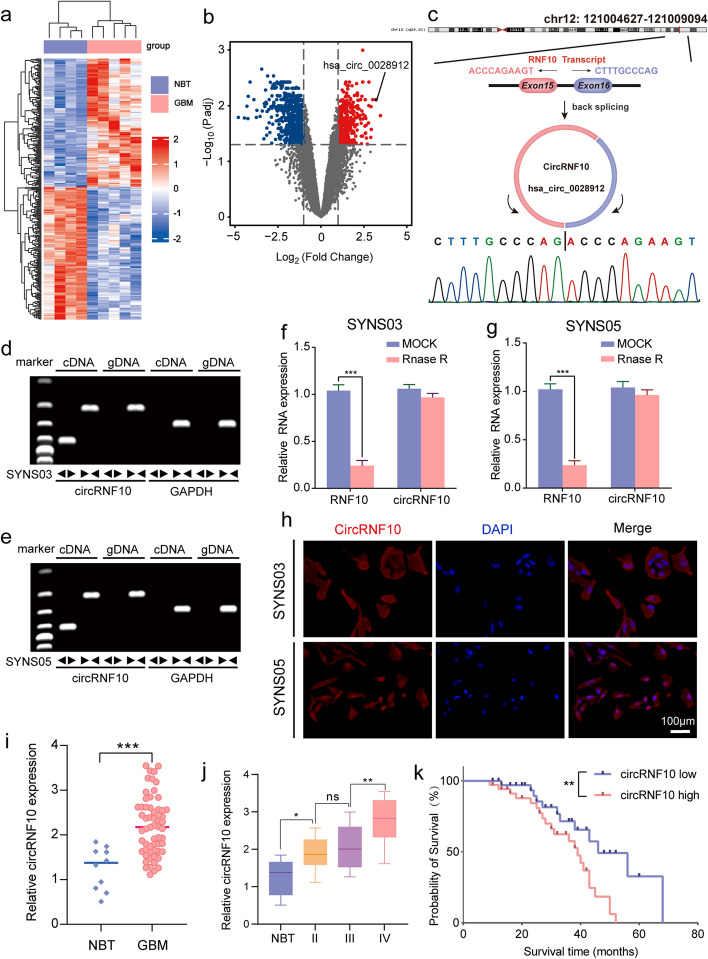
Fig. 1.
circRNF10 is upregulated in glioma and correlated with poor prognosis. a Heatmap displaying the z-scores value of circRNAs differentially expressed between normal brain tissue (NBT) and GBM in GSE165926. b Volcano plot depicting the log2(fold change) of circRNAs in the two types of tissue mentioned above. Grey dashed lines represent the cutoff value, that is, adjusted P value < 0.05, | log2[fold change] |> 1. Downregulated (blue) and upregulated (red) circRNAs are color-coded. c Schematic diagram of genomics information of circRNF10 (hsa_circ_0028912). Upper panel illustrated the maternal gene location and exon composition. And back splicing site identified by Sanger sequencing was shown in the bottom of the panel. d, e RT-qPCR analysis showing the expression of circRNF10 amplified from templates from the two GSC cell lines SYNS03 (d) and SYNS05 (e) using divergent and convergent primers. f, g The mRNAs level of circRNF10 and RNF10 in SYNS03 (f) and SYNS05 (g) after RNase R treatment. h In situ hybridization detection of circRNF10 mRNA expression in SYNS03 and SYNS05. Scale bar = 100 μm. i The circRNF10 expression level in glioma tissues (n = 70) and normal brain tissues (n = 10). j CircRNF10 expression in gliomas specimens with different malignant grades. k Kaplan–Meier survival curve for all glioma patients with high and low circRNF10 expression. Data are presented as means ± SD (three independent experiments). *p < 0.05; **p < 0.01; ***p < 0.001; ns, no significance

