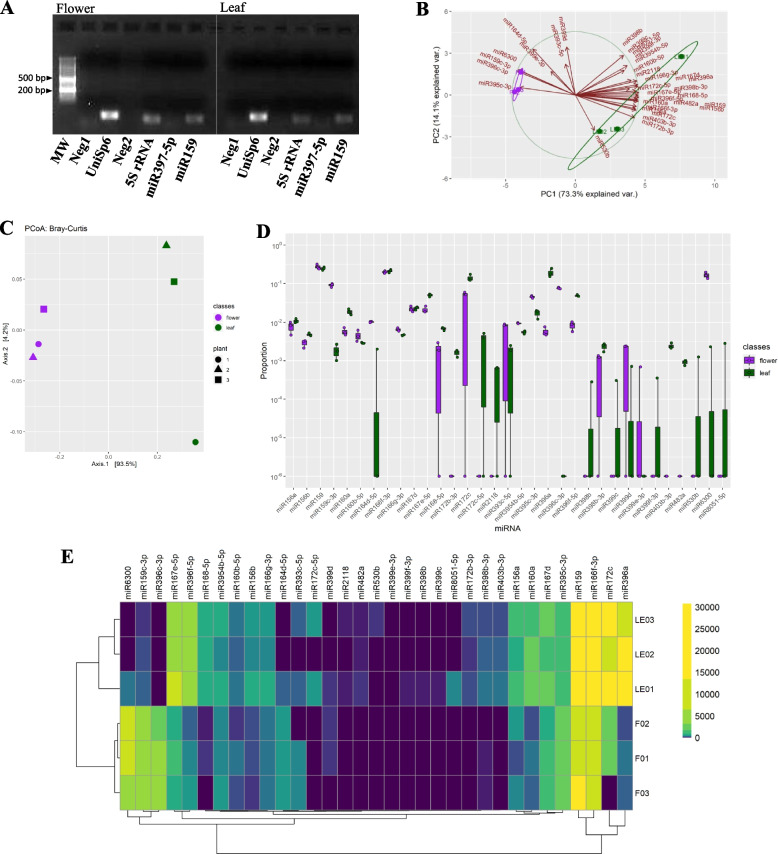
Fig. 2.
MiRNome analysis. A Validation of presence and extraction procedure for plant miRNAs. After miRNA isolation from M. sylvestris flowers (left panel) and leaves (right panel) and retrotranscription reaction, PCR amplifications were carried out and the relative products fractioned on agarose gel and visualised under UV-light. The signals for the UniSp6 (the positive control of the retrotranscription kit), the plant 5S rRNA, and one out of two selected ubiquitous plant miRNAs (i.e., miR397-5p, and miR159) are shown. In addition, the absence of amplicons in the lanes of the negative controls (Neg 1 and Neg 2; see Materials and Methods section) can be noticed. (MW, molecular weight). The full-length image of the gel is reported in Supplemental material 3. B PCA graph based on presence and abundances of the miRNAs detected in the common mallow leaves (L, green) and flowers (F, violet). Red arrows indicate the effect of each miRNA on the first (PC1) and second (PC2) component. C PCoA graph based on the frequency of miRNAs present in M. sylvestris leaves (green spots) and flowers (violet spots). D Graph of the differential abundance for the miRNAs found in leaves (green bars) and flowers (violet bars) of the common mallow. The relative abundance is plotted in log10 on the y-axis. E Heatmap of the abundance of the the detected miRNAs in the different flower and leaf samples, with relative hierarchical clustering

