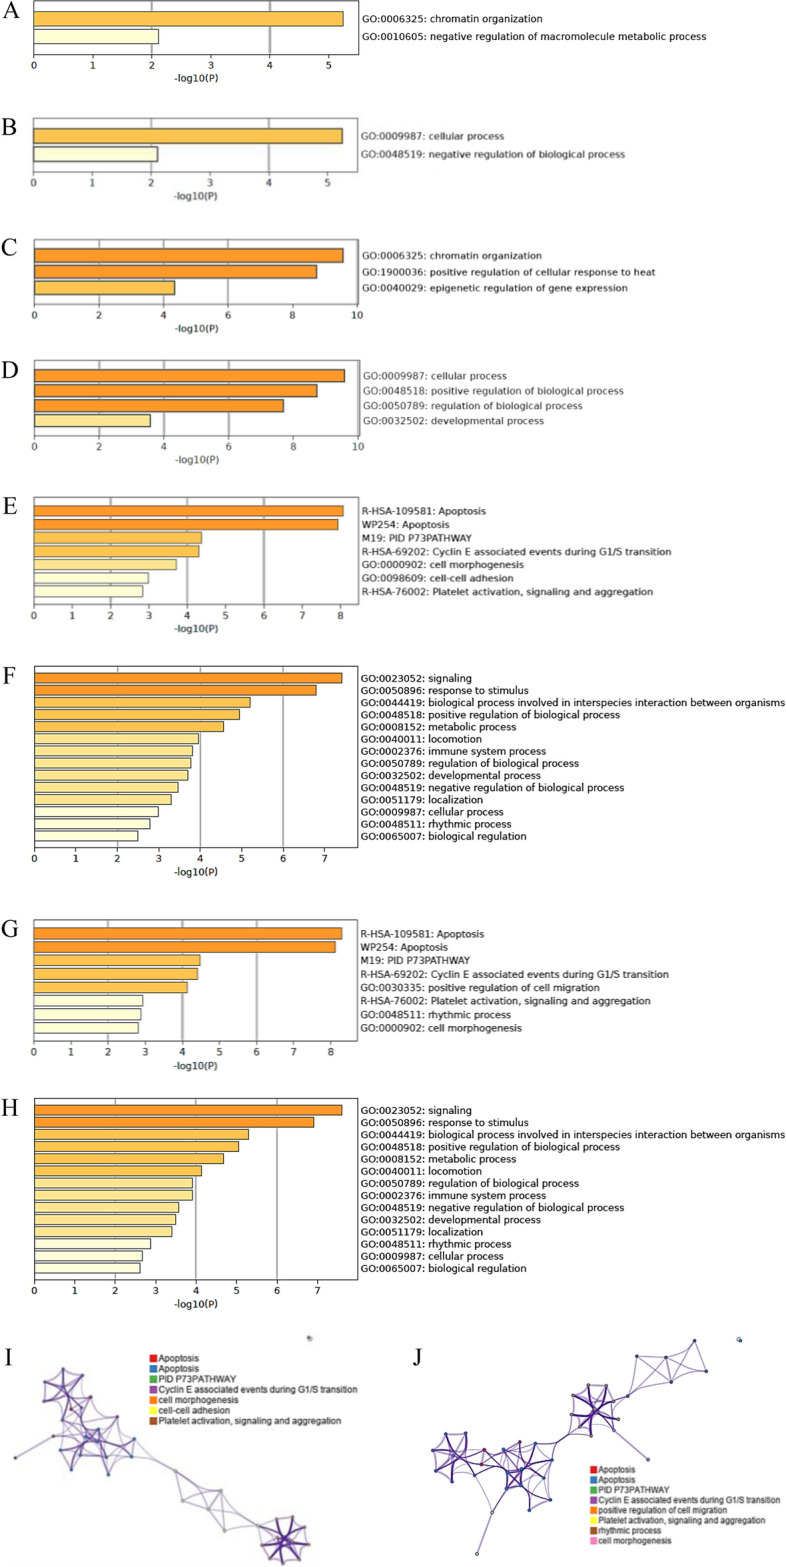
Fig. 4.

Gene Ontology (GO) enrichment analyses. A Bar graph of plant GO enriched terms across input gene lists relative to leaf miRNAs’ putative plant targets. B Top-level plant GO biological processes relative to GO enriched terms reported in panel (A). C Bar graph of plant GO enriched terms across input gene lists relative to flower miRNAs’ putative plant targets. D Top-level plant GO biological processes relative to GO enriched terms reported in panel (C). E Bar graph of human GO enriched terms across input gene lists relative to leaf miRNAs’ putative human targets. F Top-level human GO biological processes relative to GO enriched terms reported in panel (E). G) Bar graph of human GO enriched terms across input gene lists relative to flower miRNAs’ putative human targets. H Top-level human GO biological processes relative to GO enriched terms reported in panel (G). I Network of GO enriched terms relative to the analysis reported in panel (E) and (F). J) Network of GO enriched terms relative to the analysis reported in panel (G) and (H). In the bar graphs the colours indicate different p-values. In the networks, cluster IDs are coloured in different ways, nodes that share the same cluster ID are typically close, and the colour intensity of the conjunctions indicate different p-value (i.e., terms containing more genes tend to have a major significance)
