
Figure 1.
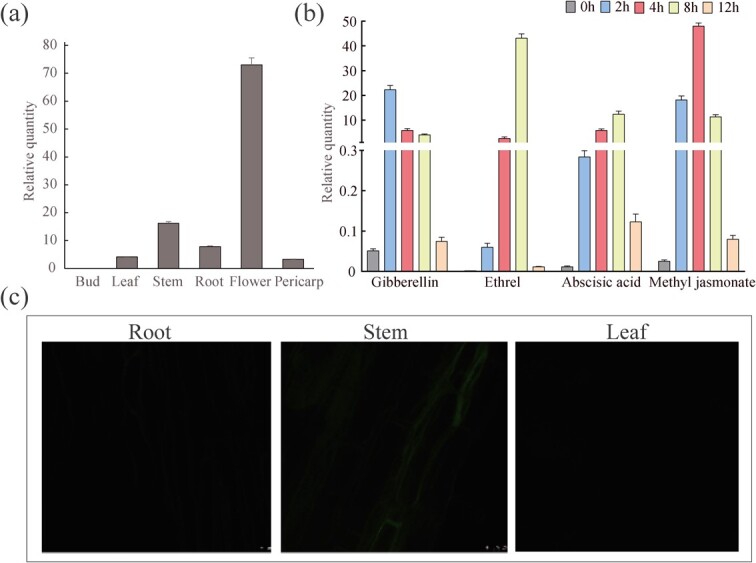
Expression patterns of TCS1 in ‘Fuding Dabaicha’s. (a) Model of shoot sampling, which included the flower, stem, root, leaf, pericarp, and bud. (b) The relative expression level of TCS1 in tea leaves sprayed with a solution containing gibberellin, ethrel, abscisic acid, and methyl jasmonate. (c) The fluorescence distribution of the Pro-TCS1-GFP protein in the roots, stems, and leaves of transgenic tobacco plants as observed by confocal fluorescence microscopy.