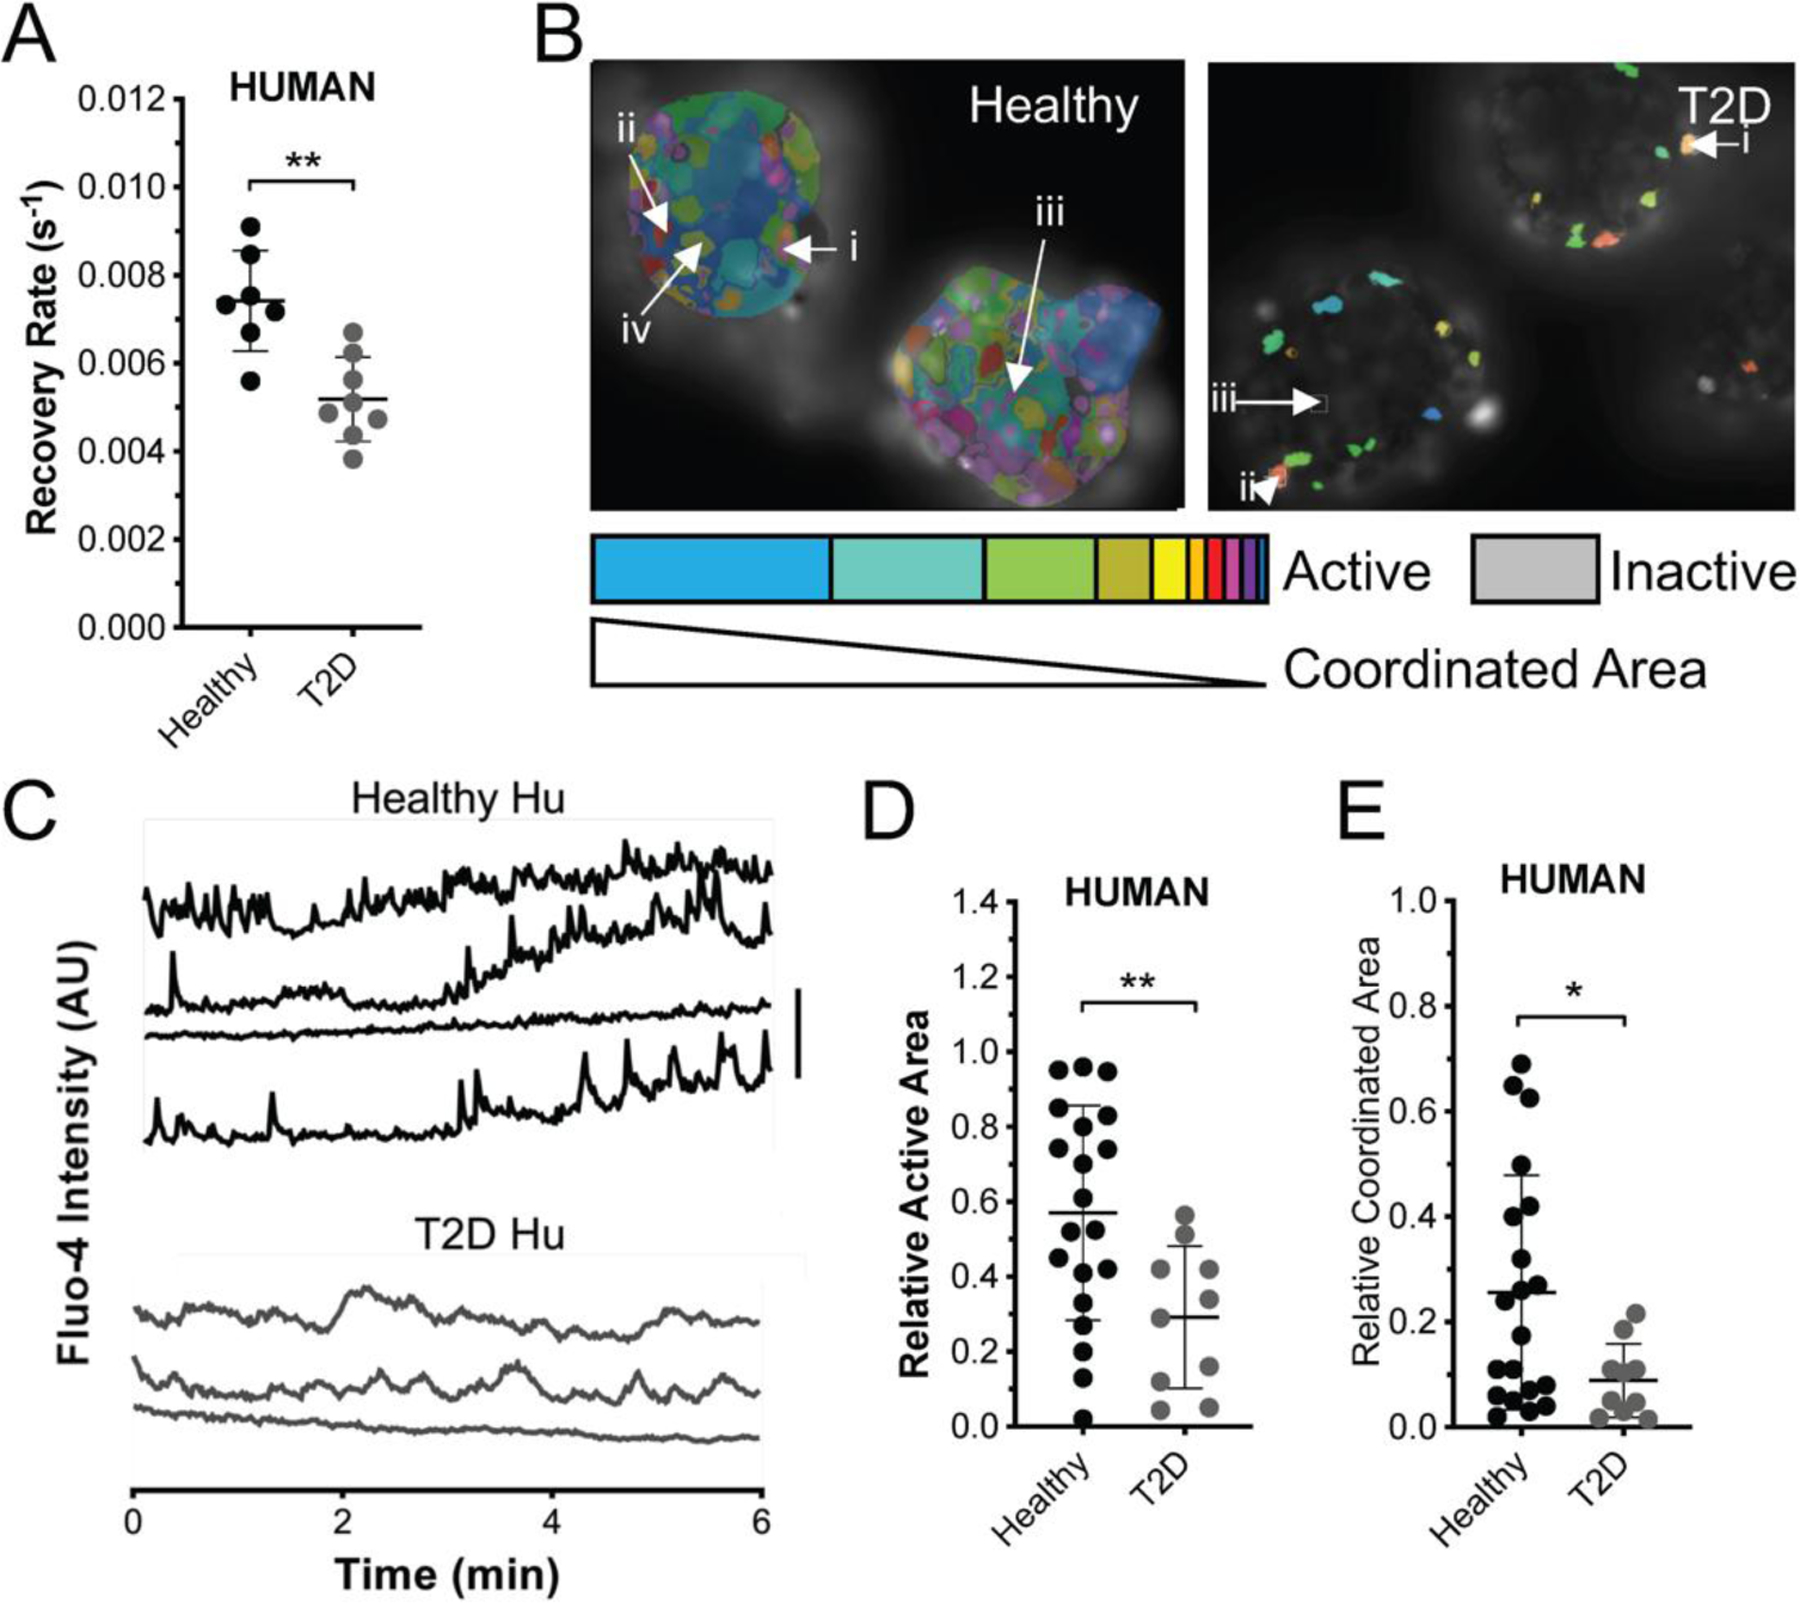
Figure 1: Reduced GJ function and [Ca2+] coordination in human islets from T2D donors.

A) Gap junction permeability, as measured by FRAP recovery rate in islets from T2D donors and from age and BMI matched healthy donors. B) Representative false color map of [Ca2+] activity and coordination in human islet from a healthy donor (top) and from a T2D donor (bottom). [Ca2+] activity is represented by presence of false color, with each color representing a separate region of [Ca2+] coordination, as indicated in legend below. C) Time courses from individual cells (i–iv or i-iii) indicated in each of these islets. D) Area of [Ca2+] activity normalized to islet size (relative active area) averaged over human islets from each healthy and T2D donor. E) Largest area of coordinated [Ca2+] activity normalized to islet size (relative coordinated area) averaged over human islets from each healthy and T2D donor. Data in A representative of n=7 healthy donors and n=8 T2D donors. Data in D,E representative of n=20 healthy donors and n=10 T2D donors. In A ** represents p=0.0012, in D ** represents p=0.0099, in E * represents p=0.029, comparing groups indicated (all unpaired Student’s t-test). Data in A,D,E presented as one point per donor, with error bars representing mean±S.D.
