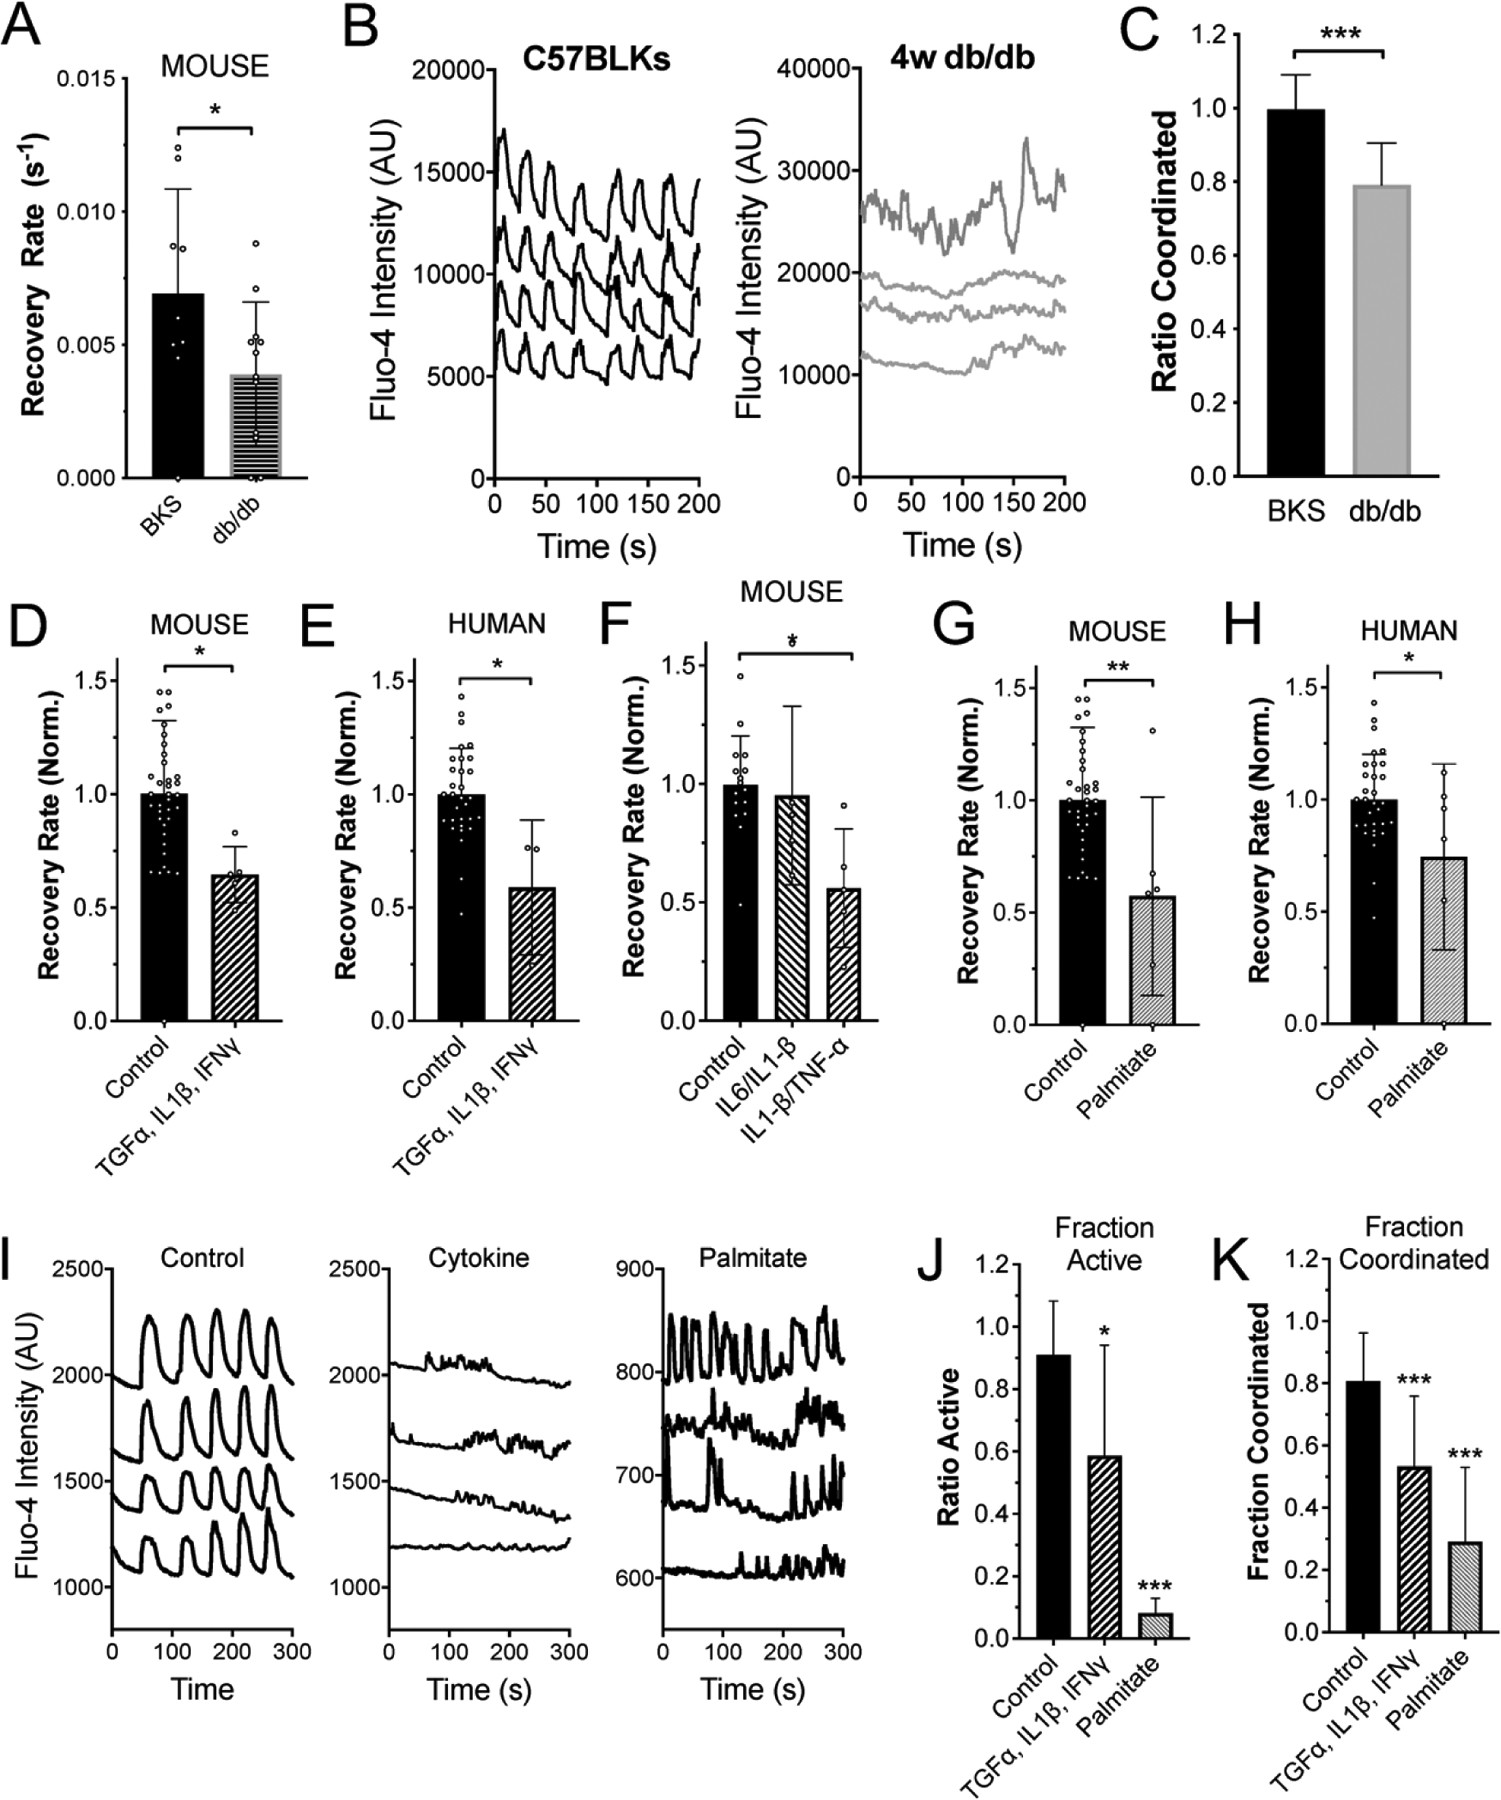
Figure 2: Diabetogenic environments disrupt GJ function and [Ca2+] coordination.

A) Mean gap junction permeability, as measured by FRAP recovery rate, in islets from 4w C57BLKS (BKS) controls and 4w db/db mice. B) Representative [Ca2+] time courses from four individual cells within an islet from a 4w C57BLKS control and 4w db/db mouse. C) Mean proportion of islets that show synchronized Ca2+ oscillations, normalized to the mean value observed in islets from BKS mice measured on the same day. D) Mean gap junction permeability, in untreated islets and islets treated with a cocktail of 1 ng/ml mouse recombinant TNF-α, 0.5 ng/ml IL-1β, 10 ng/ml IFN-γ. Data is normalized to the paired untreated islets. E) As in D for human islets treated with the same cytokine cocktail of TNF-α, IL-1β, IFN-γ. F) As in D for mouse islets treated with a cocktail of 1 ng/ml mouse recombinant TNF-α, 0.5 ng/ml IL-1β, or with a cocktail of 1 ng/ml IL1β, 10 pg/ml IL6. G) Mean gap junction permeability, in untreated mouse islets and islets treated with 200μM palmitate (bound to 0.17mM BSA). Data is normalized to the paired untreated islets. H) As in G for human islets treated with palmitate. I) Representative [Ca2+] time courses from four individual cells within an untreated islet (left), for an islet treated with TNF-α, IL-1β, IFN-γ (middle, as in D) or for an islet treated with palmitate (right, as in G). J) Area of [Ca2+] activity normalized to islet size (fraction active). K) Area of coordinated [Ca2+] normalized to islet size (fraction coordinated). Data in A representative of n=9 C57BLKS and n=12 db/db islets. Data in C representative of n=24 C57BLKS and n=5 db/db islets. Data in D representative of n=10 untreated and n=6 cytokine treated islets. Data in E representative of n=7 untreated and n=6 cytokine treated islets. Data in F representative of n=16 untreated and n=5 cytokine treated islets. Data in G representative of n=6 untreated and n=5 palmitate treated islets. Data in H representative of n=6 untreated and n=6 palmitate treated islets. In A * represents p=0.049; in C *** represents p=0.002; In D* represents p=0.020; in E * represents p=0.0066; in F * represents p=0.047; in G * represents p=0.007; in H * represents p=0.025; in J * represents p=0.0012, *** represents p<0.0001; in K *** represents p=0.0003 and p=<0.0001, comparing groups indicated (all unpaired Student’s t-test). Data in A, C-H, J,K presented as mean±S.D. with each data point representing an islet.
