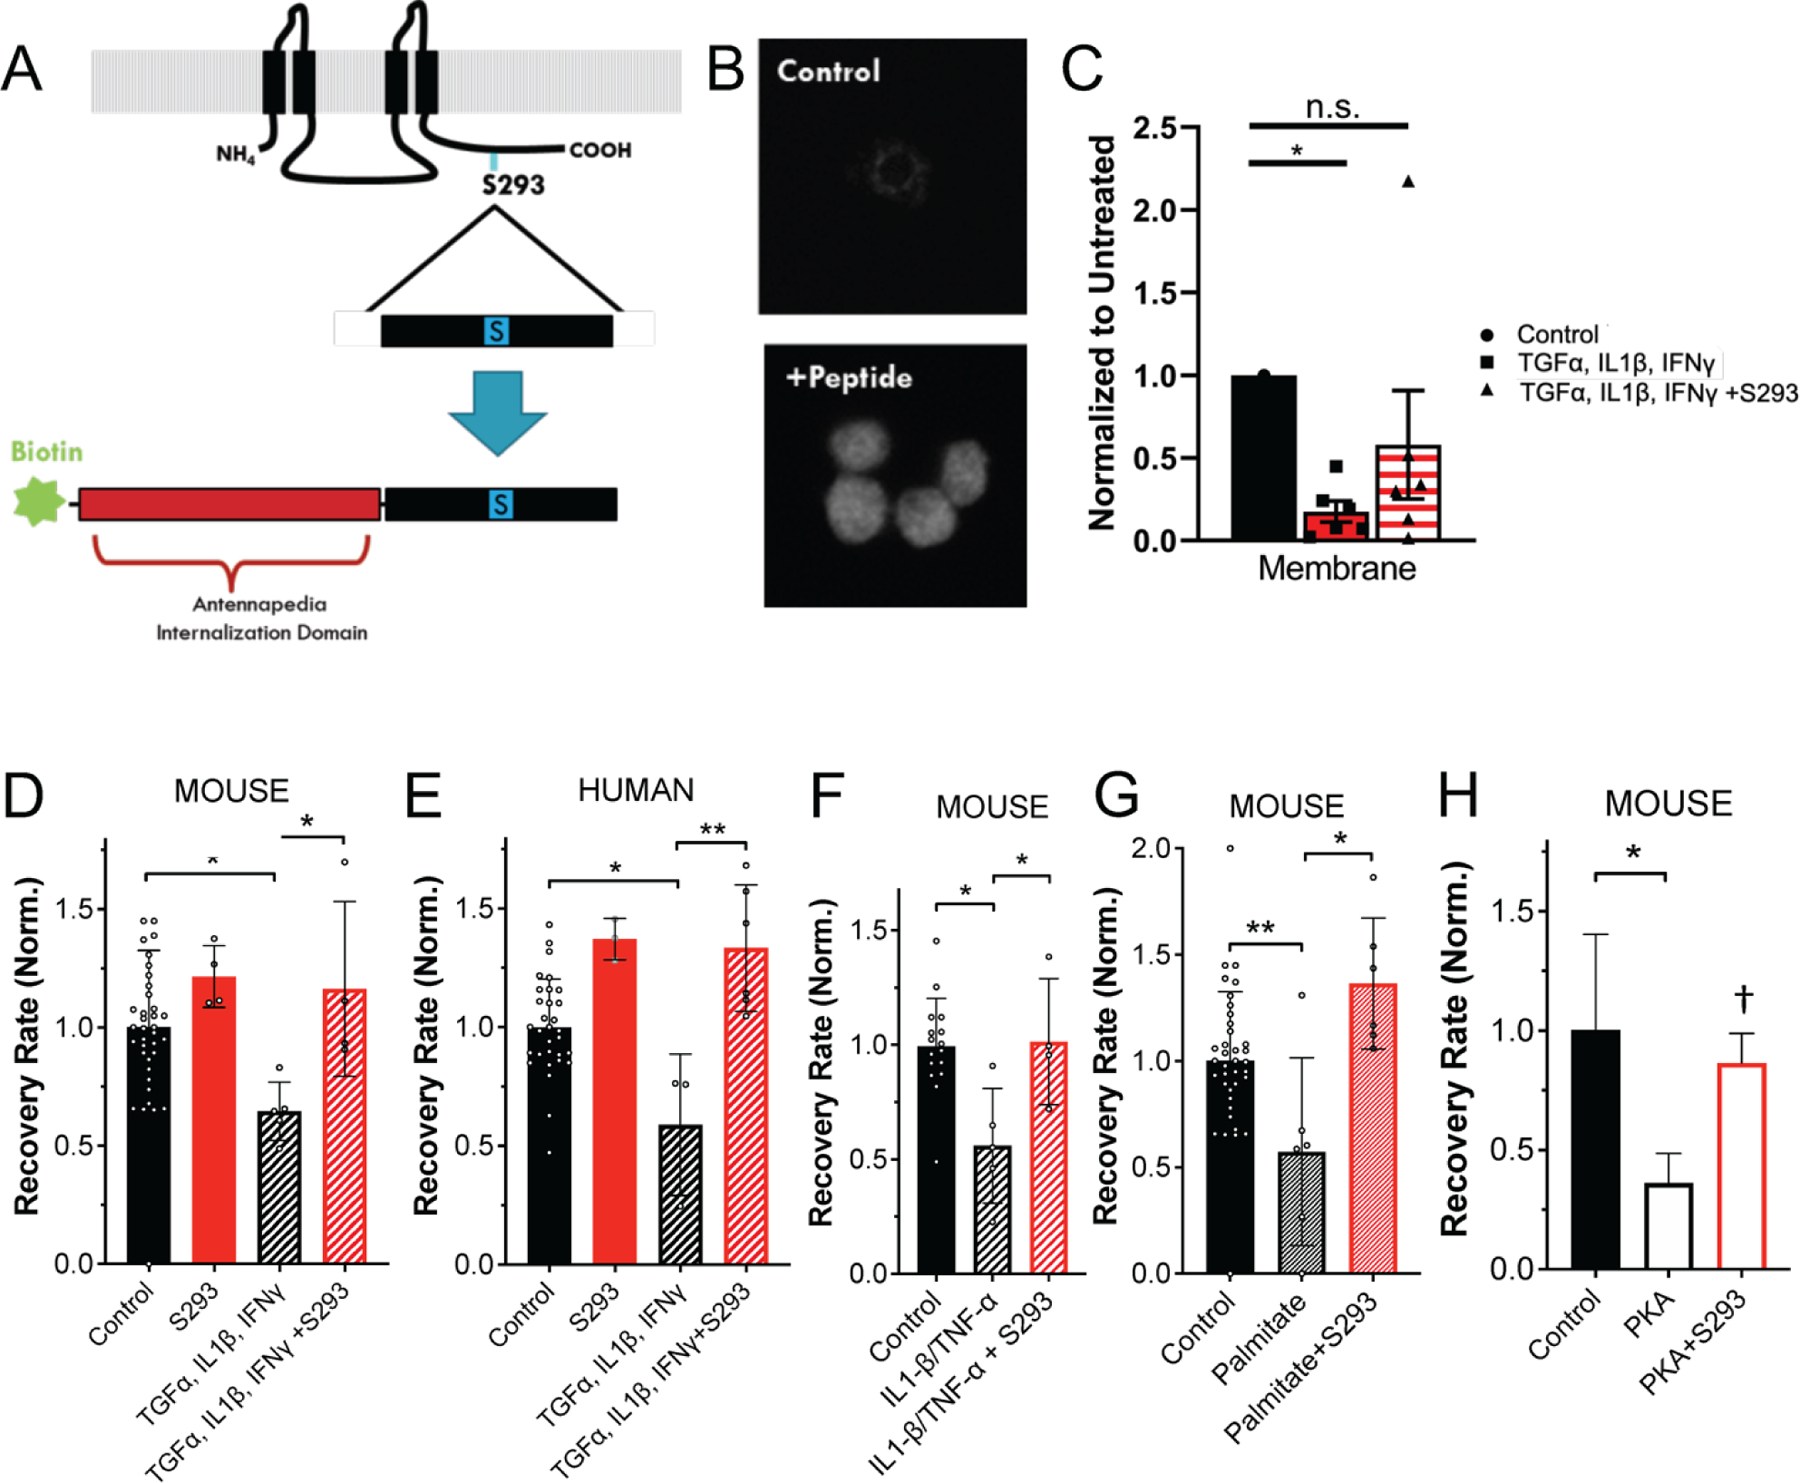
Figure 4: Cx36-S293 is critical for GJ uncoupling in diabetogenic environments.

A) Schematic of S293 peptide mimetic of Cx36 c-terminus. B) Fluorescence image of biotin labelling in control, untreated cells and cells treated with S293 mimetic. C) Mean intensity of membrane-localized Cx36, quantified from western blot of membrane fraction of mouse islets treated with a cocktail of 1 ng/ml mouse recombinant TNF-α, 0.5 ng/ml IL-1β, 10 ng/ml IFN-γ and/or 1 μM S293 peptide. D) Mean gap junction permeability, as measured by FRAP recovery rate, in mouse islets treated with a cocktail of 1 ng/ml mouse recombinant TNF-α, 0.5 ng/ml IL-1β, 10 ng/ml IFN-γ and/or 1 μM S293 peptide. Data is normalized to the paired untreated islets. E) As in D for human islets. F) As in D for mouse islets treated with a cocktail of 1 ng/ml mouse recombinant TNF-α, 0.5 ng/ml IL-1β, and/or 1 μM S293 peptide. G) As in D for mouse islets treated with 200μM palmitate (bound to 0.17mM BSA) and/or 1 μM S293 peptide. H) As in D for mouse islets treated with 300uM 6-Bnz-cAMP (PKA) and/or 1 μM S293 peptide. Data in C representative of n=6 experiments; data in D representative of islets from n=5 mice; data in E representative of islets from n=6 donors; data in F representative of islets from n=4 mice; data in G representative of islets from n=7 mice; data in H representative of islets from n=2 mice. In C * represents p<0.01 D * represents p=0.021; in E ** represents p=0.007; in F * represents p=0.036; in G * represents p=0.004; in H * represents p=0.037, † represents p=0.056; comparing groups indicated (all unpaired Student’s t-test). Data in C-H presented as mean±S.D. with each data point representing an islet (D-H) or independent experiment (C).
