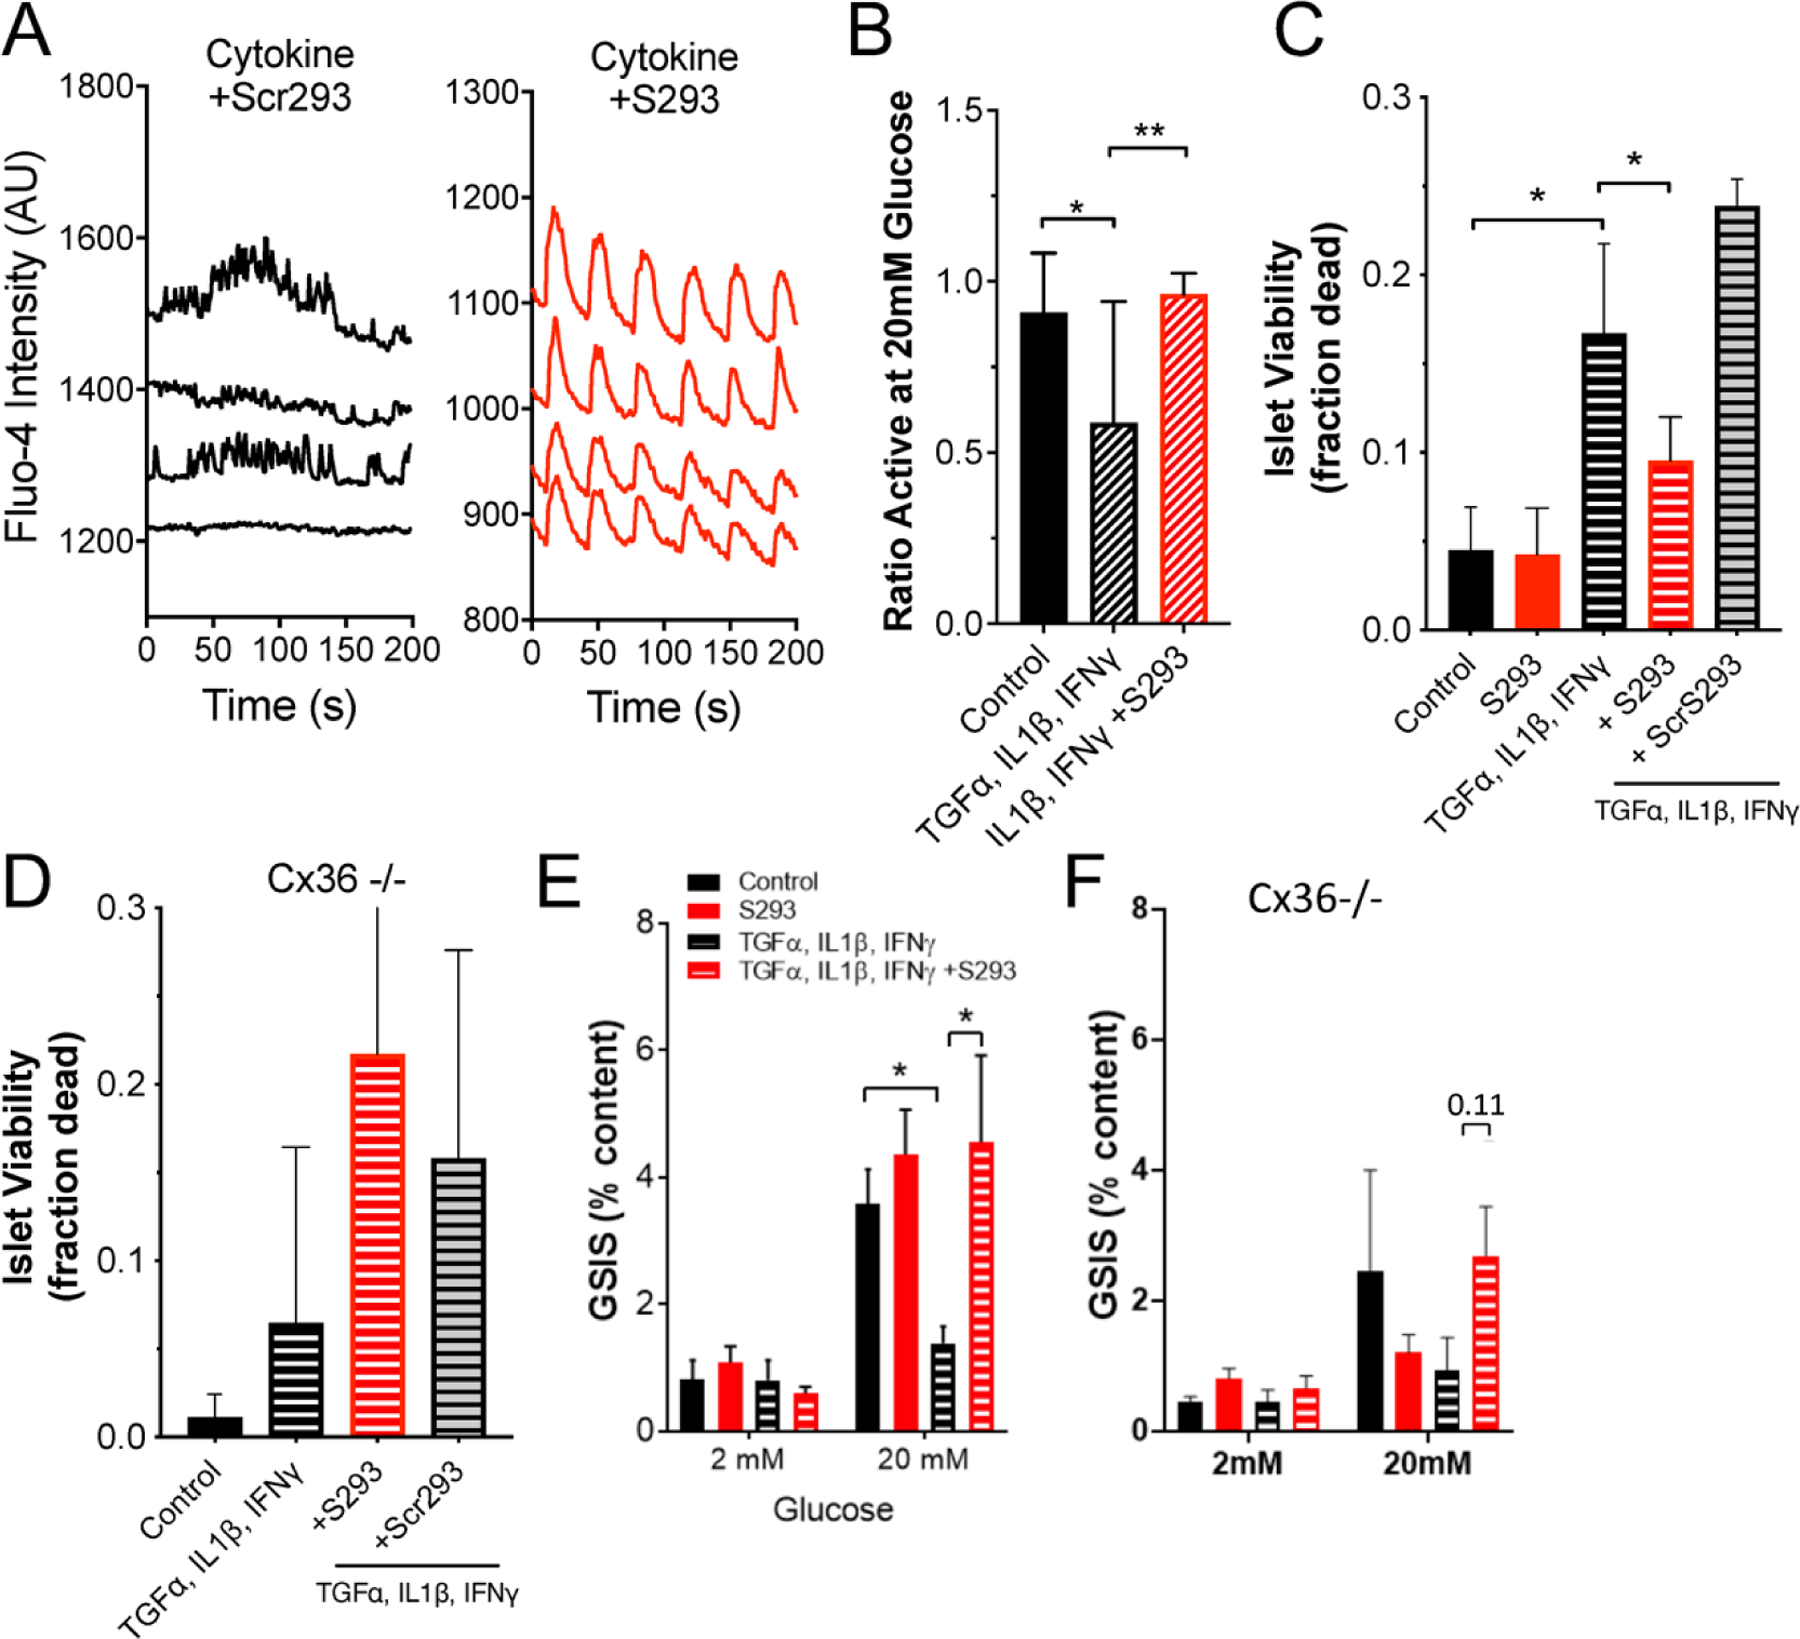
Figure 5: Inhibition of Cx36 Serine-293 maintains islet function and cell viability.

A) Representative [Ca2+] time courses from four individual cells within an islet treated with a cocktail of 1 ng/ml mouse recombinant TNF-α, 0.5 ng/ml IL-1β, 10 ng/ml IFN-γ plus 1 μM scrambled peptide (cytokine+Scr293, left) or within an islet treated with a cocktail of 1 ng/ml mouse recombinant TNF-α, 0.5 ng/ml IL-1β, 10 ng/ml IFN-γ plus 1 μM S293 peptide (cytokine+S293, right). B) Area of [Ca2+] activity normalized to islet size (fraction active) for islets treated with TNF-α, IL-1β, = IFN-γ plus = S293 peptide, as in A. C) Islet viability, as indicated by the proportion of cells labelled as dead, under a cocktail of 10 ng/ml mouse recombinant TNF-α, 5 ng/ml IL-1β, 100 ng/ml IFN-γ and/or 1 μM S293 peptide or 1 μM scrambled (Scr) peptide. D) As in C for islets from Cx36 knockout mice. E) Glucose-stimulated Insulin secretion (GSIS) in islets treated with a cocktail of 1 ng/ml mouse recombinant TNF-α, 0.5 ng/ml IL-1β, 10 ng/ml IFN-γ plus 1 μM S293 peptide. F) As in E for islets from Cx36 knockout mice. Data in B representative of islets from n=5 mice; data in C representative of islets from n=6 mice; data in D representative of islets from n=8 mice; data in E representative of islets from n=5 mice; data in F representative of islets from n=6 mice. In B ** represents p=0.021; in C ** represents p=0.0003; In E ** represents p=0.0003; comparing groups indicated (all unpaired Student’s t-test). Data in B-F presented as mean±SD.
