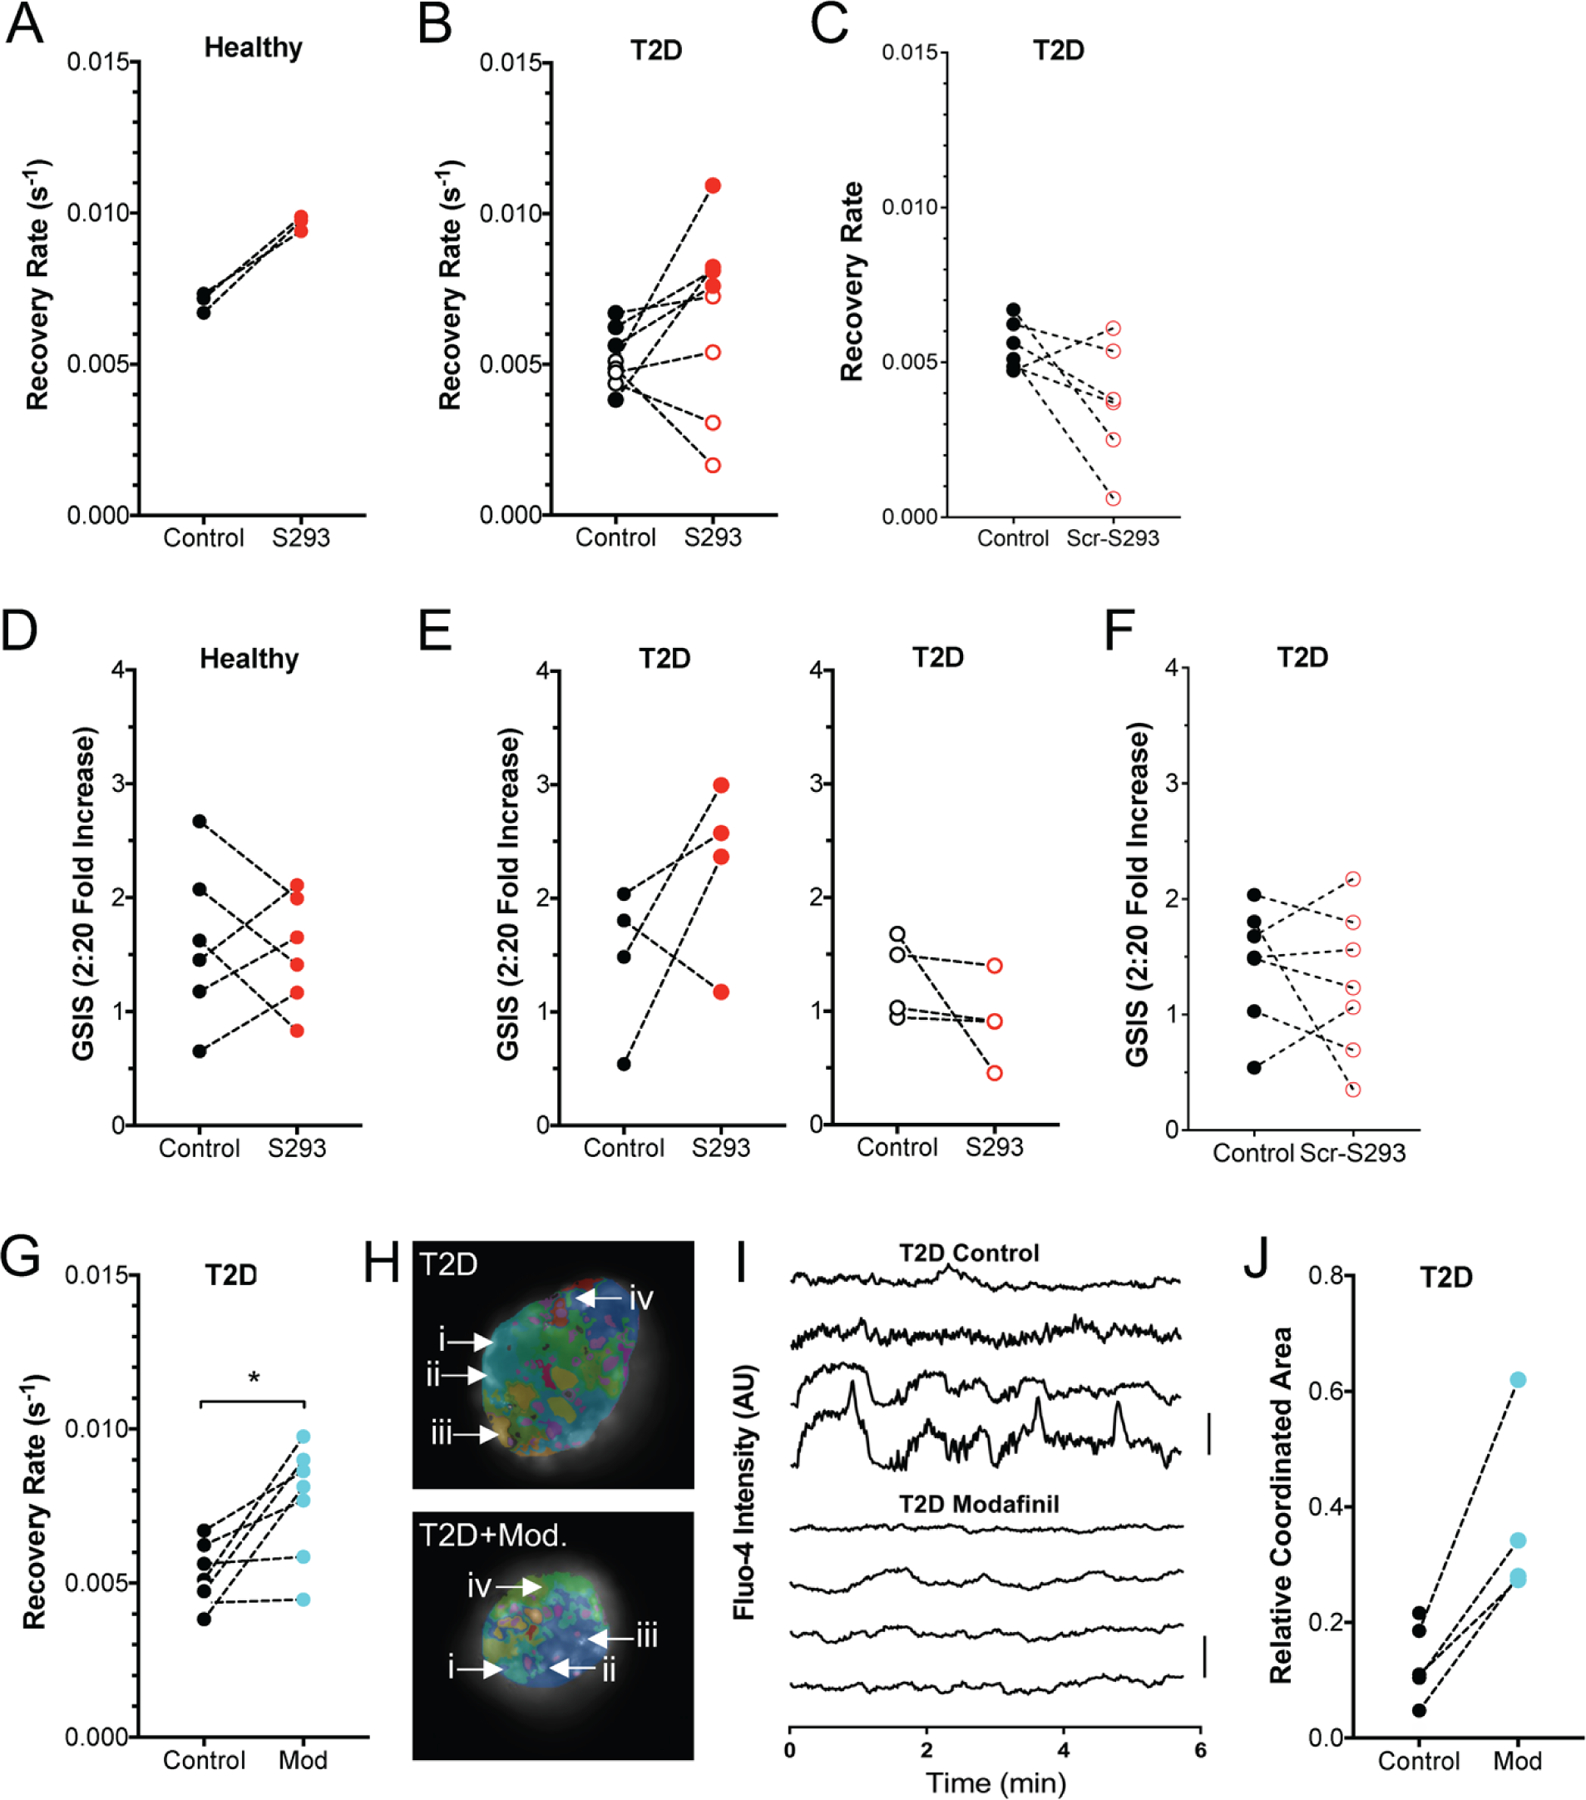
Figure 7: Inhibition of Cx36 Serine-293 restores GJ coupling and GSIS in type2 diabetic human islets.

A) Gap junction permeability, as measured by FRAP recovery rate, for human islets isolated from healthy donors, that are either untreated (Control) or treated with S293 peptide. Data is presented as the mean recovery rate over islets from each donor, with dashed line connecting data for each donor. B) As in A for human islets isolated from donors with T2D, that are either untreated or treated with S293 peptide. C) As in A for human islets isolated from donors with T2D, that are either untreated or treated with scrambled peptide (Scr-S293). D) Glucose-stimulated Insulin secretion (GSIS) for human islets isolated from healthy donors, that are either untreated (Control) or treated with S293 peptide, as in A. E) GSIS as in D, for human islets isolated from T2D donors, that are either untreated (Control) or treated with S293 peptide. Data is presented as the mean recovery rate over islets from each donor, with dashed line connecting data for each donor. Left corresponds to those donors in B that showed a >10% elevation in GJ coupling by S293 peptide. Right corresponds to those donors in B that showed a decrease or <10% elevation in GJ coupling by S293 peptide. F) GSIS as in D, for human islets isolated from T2D donors, that are either untreated (Control) or treated with scrambled peptide (Scr-S293). G) Gap junction permeability for human islets isolated from donors with T2D that are untreated (control) or treated with 100μM modafinil (Mod). H) Representative false color map of [Ca2+] coordination in human islet from a T2D donor that is either untreated (T2D) or treated with 100μM modafinil (T2D+Mod). [Ca2+] activity is represented by presence of false color, with each color representing a separate region of [Ca2+] coordination, as in Figure 1 (see legend therein). I) Time courses from individual cells (i–iv) indicated in each of these islets. J) Largest area of coordinated [Ca2+] activity normalized to islet size (relative coordinated area) averaged over human islets from each T2D donor that are untreated (control) or treated with 100μM modafinil (Mod). Data in A representative of 3 donors; data in B representative of 8 donors; data in C representative of 6 donors; data in D representative of 6 donors; data in E representative of 4 donors each; data in F representative of 7 donors; data in G representative of 7 donors; data in J representative of 4 donors. In G * represents p=0.018; in J * represents p=0.04; comparing groups indicated (paired Student’s t-test). Data in A-G, J presented as one point per donor.
