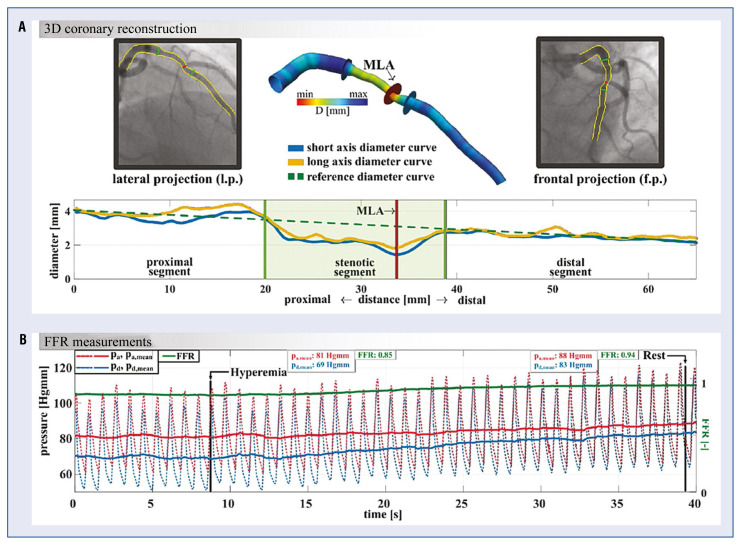
Figure 1.
A. Detection of the segments by QAngio XA 3D. The stenotic segment lies between the two green lines, marked by shaded green color; B. Sample pressure trace after intracoronary adenosine injection. Red line: proximal (aortic) instantaneous pressure trace, red dashed line: moving average of the proximal pressure, blue line: instantaneous pressure trace distally to the coronary stenosis, blue dashed line: moving average of the distal pressure, green line: the ratio of the average distal and the proximal pressure (FFR); min — minimum; max — maximum; 3D — three-dimensional; D — diameter; mm — millimeter; MLA — minimal lumen area; Hgmm — millimeter of mercury; pa mean — mean pressure value in the proximal lumen area; pd mean — mean pressure value in the distal lumen area; FFR — fractional flow reserve; s — second.

