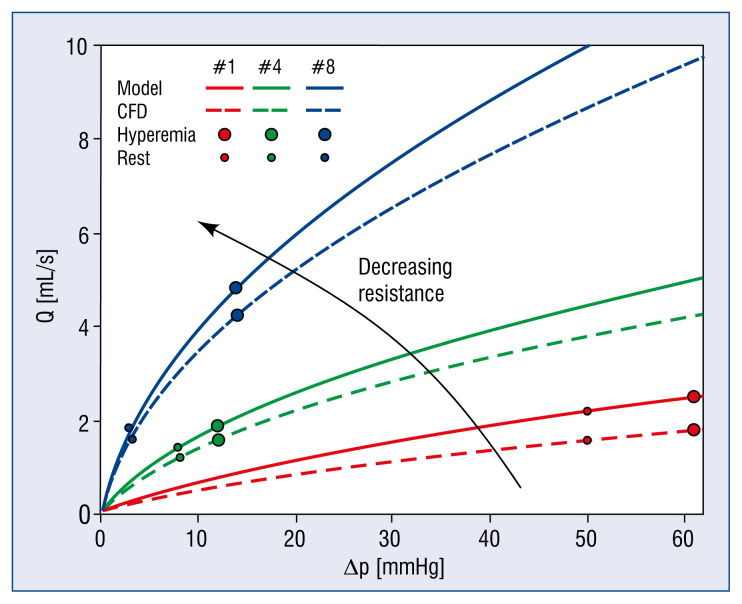
Figure 5.
Flow rate as a function of the pressure difference Q(Δp). Three distinct cases that represent the lowest (blue), middle (green) and largest (red) resistances in the studied population. The solid and dashed line depicts the curve defined by the simple model and steady CFD simulations by ANSYS, respectively. The marked points on each curve are the solutions of the flow equations by substituting the pressure drop of the given case from the resting and hyperemic condition; CFD — computational fluid dynamics calculation by ANSYS; Q — flow rate; mL/s — milliliter/second; CFR — coronary flow reserve; Δp — pressure loss; mmHg — millimeter of mercury.

